As digital marketing strategists, we don't always have the tools required to do our jobs. Even simple tasks, such as Google Ads monitoring, can be much more challenging than they should be.
That is because you can't enter your budget or conversion targets into the platform.
It's difficult to know what to do without the basic context of goals vs. actuals.
Most third-party software and DIY Google AdWords dashboard templates that attempt to solve this problem are ineffective. The objectives of paid search managers are seldom met.
They're either too simple to provide insights or too cluttered to be understood at a glance.
In this blog, we'll explore some great Google AdWords dashboard templates to help you with your job.
Google AdWords Dashboard Templates We Bet On!
A professional Google AdWords dashboard template summarises key performance indicators of SEA campaigns (Search Engine Advertising). It also allows for data-driven performance optimization of AdWords campaigns and effective reporting of results.
Let's take a look at the top 5 Google AdWords dashboard templates:
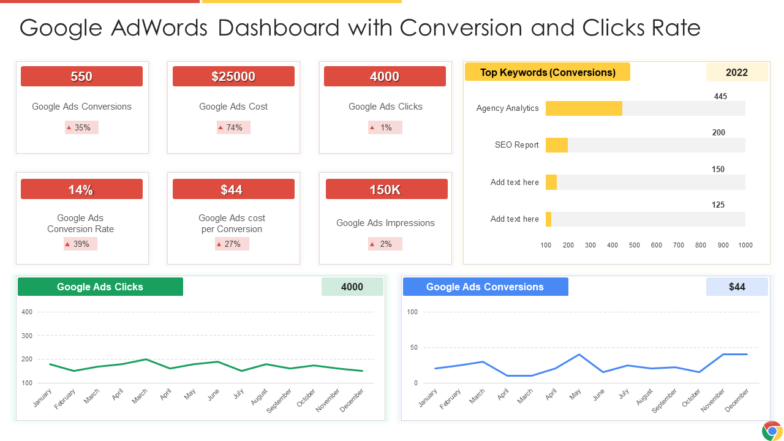
Template 1: Google Adwords Dashboard With Conversion And Clicks Rate
See how your Google AdWords campaigns fare against your targets with the help of this predesigned dashboard. Its easy-to-understand layout promotes clarity and helps you comprehend results at a glance. This dashboard summarizes conversion and click-through rates monthly, so you can identify your best months. Get it now.
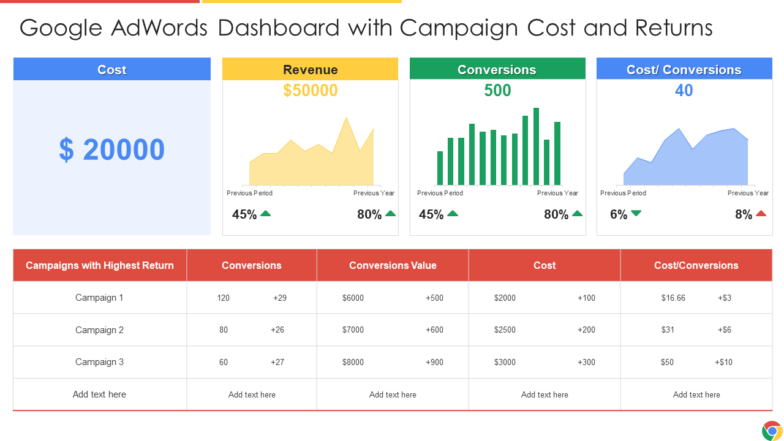
Template 2: Google AdWords Dashboard With Campaign Cost And Returns
An empire isn’t built with just one brick! On the same note, paid marketing can’t rely on one ad campaign. You have to try and test feasible options to get desired results, which makes tracking individual campaigns challenging. Our PPT Template makes it easy. It helps you monitor multiple campaigns and evaluate their performance in terms of campaign cost and respective conversions. Grab it now.
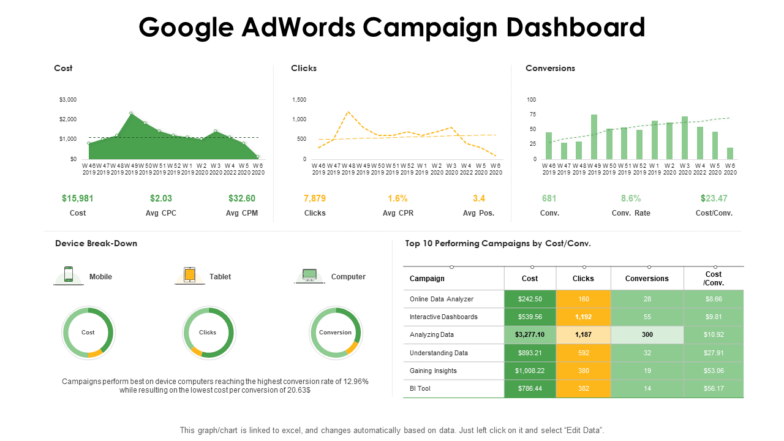
Template 3: Google AdWords Campaign Dashboard
If you want to perform a comprehensive assessment of your Google AdWords campaign, this template is your ally. It gives a concise report on cost, clicks, and conversions. It also offers a device-breakdown section, where you can on which device (mobile, tablet, and computer) your campaign performed the best. Download it now.
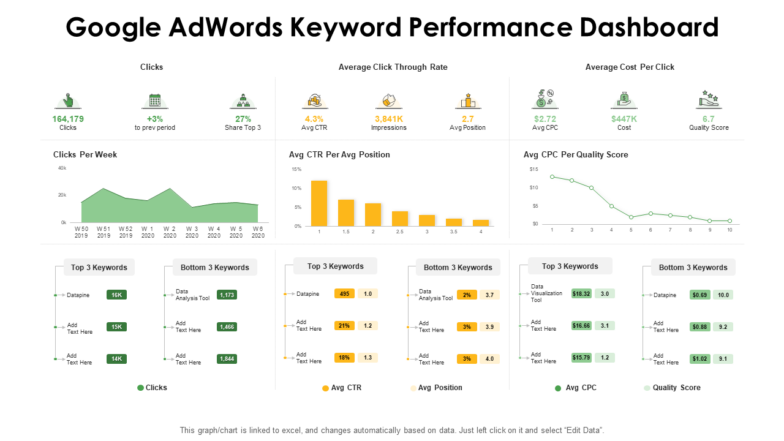
Template 4: Google AdWords Keyword Performance Dashboard
The importance of keywords in paid ads campaigns can’t be overstated. This dashboard helps you optimize keywords by highlighting the top and bottom three keywords in terms of clicks, average CTR (Click-through Rate), and average CPC (Cost-per-Click). Having such insights goes a long way in improving your paid ad campaigns. Get it now.
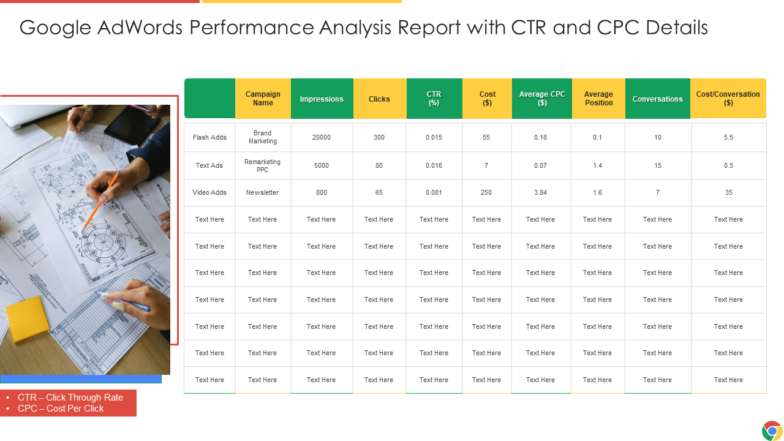
Template 5: Google AdWords Performance Analysis Report
This template helps you construct a performance analysis report of your Google AdWords campaigns. Even if you have several campaigns running at a time, you can employ this template to piece together a consolidated report. It highlights total impressions, clicks, cost, and conversions against individual campaigns. Download it now.
The Takeaway
Instant access to performance goals and actuals provides insights that can help you become a more strategic paid search marketer.
You'll finally be able to move the needle and drive better management decisions for your clients with our Google Ads dashboard templates.
FAQs on Google AdWords Dashboard
How do I create a Google dashboard?
If you want to create your own Google dashboard, follow these steps:
- Sign in to Google Analytics.
- Navigate to your view.
- Open Reports.
- Click CUSTOMIZATION > Dashboards.
- Click Create.
- Select Blank Canvas (no widgets) or Starter Dashboard (default set of widgets) in the Create Dashboard dialog.
Go, try it out.
What is an advertising campaign dashboard?
A dashboard for your advertising campaign is the most convenient way to see your ad performance at a glance. All your advertising efforts, whether they are Google Ads PPC campaigns or Facebook Ads campaigns, can be tracked and reported on from a single dashboard.
It allows you to stay on top of your clients' (or your own) marketing strategies and thus optimize your marketing campaigns.
How do I create a marketing dashboard?
Determine your target audience
The most critical step in creating an effective dashboard is defining your audience. In general, data dashboards and data visualization are intended to tell a story, so you must know who is listening.
Set your stakeholders' goals
By definition, dashboards are unique. Determine your stakeholders' short- and long-term goals, and create data views with levels of granularity.
Establish marketing KPIs
It is critical to determine which metrics are essential for your specific marketing strategy (and it's even more important as an agency to understand what strategy to use). These KPIs may include marketing performance metrics specific to each program or campaign, such as likes, clicks, dwell time, traffic, click-through rate, etc.
Identify Data Sources and Provide a Unified View
New marketing platforms have simplified the management of everything from a company's website to email marketing, call tracking, and social media strategy. Each of these data sources will have its own metrics and data.
Data visualization
Marketing analytics tools can provide you with a plethora of data, and you must convey the right message with your marketing analytics dashboard (because your visuals can easily share a message you didn't intend to convey).
Data integration
A marketing team today employs hundreds of tools that contain a plethora of metrics. A key goal of any analytics dashboard is to consolidate and integrate data into a consistent view using a visualization tool.
What are the benefits of using a dashboard?
A dashboard is a one-page summary of information analysis that is easy to read. It provides a high-level overview of your system. The benefits are:
Customizable
Dashboards could be melted to specific users and expectations. They display the most valuable and relevant set of data.
All-in-one
Previously, users would spend significant time reviewing and analyzing various reports to reach a conclusion. This tool displays a comprehensive situation report of the desired information at a glance.
Go into specifics
However, having everything in one package does not imply that there are no details. Dashboards allow users to drill down as far as they need to by selecting the desired variable or object.
Mobile device accessibility
Most dashboard software is designed to work with any mobile device. The goal is to get the most up-to-date information to anyone, anywhere, and at any time.




 Customer Reviews





I have read your blog, and it is so amazing and informative for me to understand. After reading your blog, I got to know more about google adwords and their benefits and effects and more about it.