


Retail store sales plan dashboard




Try Before you Buy Download Free Sample Product
 Impress Your
 Audience
 100%
100% Editable
 Save Hours
 of Time


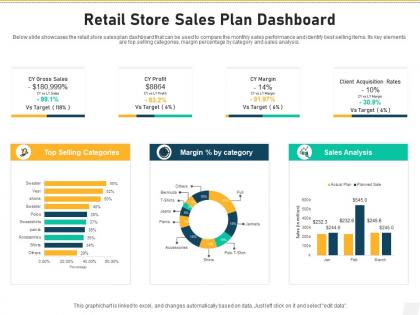
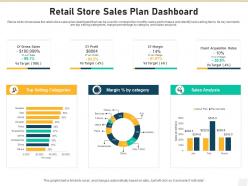
Below slide showcases the retail store sales plan dashboard that can be used to compare the monthly sales performance and identify best selling items. Its key elements are top selling categories, margin percentage by category and sales analysis.
People who downloaded this PowerPoint presentation also viewed the following :
Retail store sales plan dashboard with all 2 slides:
Use our Retail Store Sales Plan Dashboard to effectively help you save your valuable time. They are readymade to fit into any presentation structure.
FAQs for Retail store
Track your sales revenue, conversion rates, and average order value first - those are non-negotiables. Customer acquisition cost vs lifetime value will tell you if your marketing spend actually makes sense. Also watch inventory turnover and gross margins closely. Oh, and don't forget traffic (web or foot traffic). I swear, most people build these crazy dashboards with 30 metrics that just confuse everyone. Stick to maybe 8-10 that actually matter for decisions. Set up alerts when things go sideways so you're not finding out about problems three weeks too late.
Dude, real-time dashboards are game-changers. Instead of waiting for yesterday's reports, you're seeing everything as it happens. Flying bestsellers? Staff shortages during rush hour? You'll catch it all immediately. I swear it's like having superpowers for your store. When foot traffic jumps but sales tank, boom - you can fix staffing or run instant promos. The trick is setting up alerts for your must-watch numbers so the thing actually helps instead of just sitting there looking pretty. Way better than playing catch-up with old data, trust me.
Honestly? Just go with Tableau or Power BI for retail stuff. Both handle multiple data sources really well and the visualizations look clean. Power BI's cheaper, especially if you're already using Microsoft everything. Tableau costs more but it's basically what everyone considers the best - though that might be overkill depending on what you need. You could build something custom with Python tools like Streamlit, but that's only if you've got the time and coding skills. I'd probably start with Power BI's free trial first. See if your team actually likes using it before committing to anything expensive.
Honestly, retail dashboards are game-changers for inventory stuff. You can see what's running low before you're completely out, plus catch those dead products just sitting there costing you money. I swear, every store has those "seemed brilliant at the time" purchases gathering dust. The cool part? Sales velocity data shows you what's actually moving vs what isn't across locations. Set up alerts so you're not scrambling last minute. Way better than guessing when to reorder - the numbers don't lie about buying patterns.
Your customers are basically doing free consulting for you - they're pointing out exactly what's broken. Long checkout lines in their complaints? Time to put wait times front and center on your dashboard. Keep hearing about empty shelves? Inventory tracking becomes your new best friend. I'd honestly just flip through recent feedback once a month and tweak what you're watching. Way better than guessing what matters. Their complaints show you which metrics actually need alerts set up, not just the ones that look impressive to your boss. Keeps you focused on fixing real problems instead of obsessing over internal operations stuff.
So retail dashboards are basically your crystal ball for forecasting. They show you sales patterns, inventory, and customer behavior in real-time instead of making you wait for those boring month-end reports. The visual setup makes spotting seasonal trends and demand shifts way easier - honestly, I don't know how people did this with spreadsheets before. You can see what's happening across different locations and overlay stuff like promotions. My advice? Set up alerts for big metric changes so you're not always playing catch-up. Way better than scrambling after problems hit.
Honestly, connecting your social metrics to sales data is a game changer. You'll actually see if that Instagram post everyone loved translated to real purchases - which doesn't always happen, btw. The cool part is spotting patterns way faster, like which campaigns bring in actual revenue vs just likes. I'd start with whatever platform you use most, then add others once you see how useful it is. You can even track if negative comments are hurting sales before things get too bad. It's one of those things that seems obvious after you do it.
Honestly, dashboards are a game-changer for this stuff. Track sales per hour, customer interactions, how fast people complete tasks - the usual suspects. Average transaction values too, plus customer satisfaction if you're collecting that data. You'll start noticing patterns pretty fast, like who crushes it on morning shifts versus afternoons. Set alerts when someone's numbers drop below target so you can jump in early. Oh, and definitely be upfront about what you're monitoring. Nobody likes feeling watched all the time - trust me on that one. It helps you figure out who needs extra training too.
Don't cram everything onto one screen - users will just get overwhelmed and bounce. Focus on maybe 5-7 metrics that actually matter for your business, like conversion rates and inventory turnover. Skip the vanity stuff (page views look cool but don't pay the bills). Make sure your data updates often enough to be useful - stale numbers are basically useless when you're dealing with stockouts. I learned this the hard way at my last job. You can always add more metrics later if people ask for them, but start lean.
So basically your retail dashboard shows you how customers actually shop - not how you think they do. Look at purchase data by different groups, time periods, product types. You'll see seasonal patterns, which items sell together, customer value over time through charts and heat maps. The cool part is filtering by age or buying history. Like, millennials vs Gen X buy totally different stuff (shocking, I know). Plus you can see how often people really come back - probably way less than expected, honestly. Then use all this to plan inventory better and create marketing that doesn't suck.
Dude, mobile accessibility is everything for retail dashboards. Your team's constantly moving around - sales floor, between stores, working from home. Quick decisions can't wait for someone to get back to their computer. Nobody wants to squint at tiny charts while making inventory calls either. Touch-friendly charts are a must. When managers can spot trends and track daily sales on their phones, they'll actually respond to issues as they happen. Oh, and make sure data loads fast on crappy connections - you know how retail locations can be with WiFi.
Line charts are your best friend here - throw in some trend lines and you'll spot seasonal patterns instantly. I'd also track month-over-month percentage changes since those really show the swings. Heat maps are clutch for seeing which products peak when, way better than scrolling through endless spreadsheets (trust me on this one). Just make sure you're comparing like periods - Q4 to Q4, not random months. Oh, and definitely add filters so people can break it down by category or region. Seasonality hits different across products and markets.
Line charts are perfect for tracking sales trends - use those first. Heat maps work amazing for comparing store performance across locations. Bar charts handle category breakdowns really well too. Geographic maps are honestly my favorite when you've got multiple stores because regional patterns just pop out at you. Funnel charts help with conversion tracking through your sales flow. Scatter plots can show cool connections between things like foot traffic and revenue. Just don't go crazy with too many chart types on one dashboard or people won't even look at it.
Honestly, retail dashboards are game-changers because they pull everything together - your online store, physical locations, mobile app, social stuff. Instead of hopping between like five different tools (which is honestly exhausting), you get one clean view of how customers actually shop. Maybe they're browsing on their phone during lunch but coming in-store later to buy. The dashboard shows you which channels are worth your ad spend and which ones are just... meh. You can tweak campaigns on the fly too. Oh, and definitely set up cross-channel attribution first - that's what tells you which touchpoints actually deserve credit for sales.
Look, different store formats need totally different metrics. Convenience stores? Focus on basket size and conversion rates. Bigger stores should track department performance and cross-selling instead. Traffic patterns are key too - grocery stores need hourly foot traffic data, but specialty retailers care way more about dwell time and customer journeys. (Honestly, we screwed this up once with a one-size-fits-all dashboard and it was a mess!) Your inventory alerts need customizing too since fast-moving convenience stuff has different thresholds than seasonal department store items. Start with your top 3 business drivers per format, then build everything around those specific KPIs.
-
Informative presentations that are easily editable.