

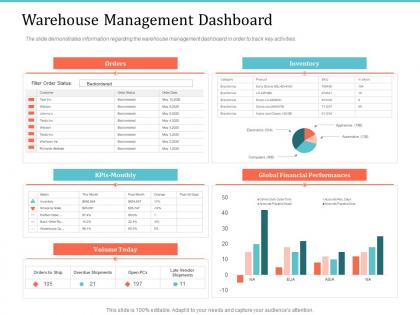
Warehouse management dashboard implementing warehouse management system




Try Before you Buy Download Free Sample Product
 Impress Your
 Audience
 100%
100% Editable
 Save Hours
 of Time


The slide demonstrates information regarding the warehouse management dashboard in order to track key activities.
People who downloaded this PowerPoint presentation also viewed the following :
Warehouse management dashboard implementing warehouse management system with all 2 slides:
Use our Warehouse Management Dashboard Implementing Warehouse Management System to effectively help you save your valuable time. They are readymade to fit into any presentation structure.
FAQs for Warehouse management dashboard implementing
Honestly, just focus on the big four first: inventory accuracy, order fulfillment rates, picking productivity, and how much of your warehouse space you're actually using. Those will tell you everything about day-to-day performance. Labor costs per order are huge too - management loves seeing those numbers stay low. On-time shipments matter obviously, but I learned that one the hard way when our late delivery complaints went through the roof last quarter. Return processing times and cycle count accuracy are nice to have if you've got bandwidth for it. Start simple though. Your dashboard should make sense in like 30 seconds or you're overdoing it.
Dude, real-time dashboards are a game changer. You'll catch issues the second they pop up instead of finding out about them tomorrow morning. Bottlenecks, low inventory, productivity drops - you see it all happening live. It's honestly like having x-ray vision for your warehouse (okay maybe that's dramatic but still). Your team can jump on problems before they get worse. Redirect people, fix quality issues, whatever needs doing. Oh and don't try to track everything at once - pick your top 3-5 metrics first and build from there.
So inventory turnover shows how fast you're actually moving products through your warehouse. Higher numbers mean better cash flow and less junk sitting around collecting dust - which honestly saves you a ton of headaches. It's just cost of goods sold divided by your average inventory value. Your dashboard should break this down by categories or individual SKUs so you can see what's selling like crazy versus what's not moving at all. Then you can tweak your storage setup and figure out better reorder timing. Super useful metric that most people don't pay enough attention to.
So predictive analytics is basically way smarter than just looking at last month's sales. It pulls in everything - seasonality, supplier delays, even weird stuff like weather patterns. Pretty neat how it works, honestly. Your system can spot potential shortages weeks out and tell you exactly when to reorder. No more scrambling when you're suddenly out of stock (been there). It also prevents you from sitting on too much inventory, which is just money collecting dust. Start by connecting your sales data with current stock levels - that's where the magic happens. Way better than guessing.
Real-time inventory tracking is a must-have for your dashboard. Your team needs to spot stock levels and pending shipments without hunting through tons of screens. Low stock alerts are clutch - seriously saved me from so many headaches back when I dealt with this stuff. Heat maps showing busy warehouse zones help a lot too. Order status visibility should be right there on the main view. Mobile compatibility is huge since everyone's constantly walking around. Oh, and don't forget basic reporting for daily summaries. Fast loading times will keep your team happy.
So basically, connecting your dashboard to all your other systems turns it into mission control for everything. No more jumping between your ERP, warehouse system, and shipping platforms - data just flows in automatically. Your inventory numbers actually match what accounting sees, carrier updates pull straight through, and you're not stuck reconciling spreadsheets all day (honestly, life's too short). HR metrics sync up too. Pick the systems you're constantly alt-tabbing between - that's where you'll see the biggest wins. Way less manual work, better accuracy, and you can actually trust your numbers.
Dude, mobile dashboards are honestly a game-changer for warehouse stuff. Instead of sprinting back to your desk computer every five minutes (which is super annoying), you can just pull up inventory levels and shipment tracking right from the floor. Real-time updates mean you'll catch problems as they happen rather than finding out way too late. Your team can report issues straight from their phones too, which speeds everything up. I'd start with whatever numbers you're checking most often - get those working on mobile first, then expand from there.
Honestly, automated reports are a game changer - no more wasting hours pulling data from different systems. They'll catch inventory issues and bottlenecks before you even notice them. Real-time alerts for stuff like slow-moving stock or zones that aren't performing well. Your team can actually focus on fixing problems instead of hunting for them. I'd probably start with just your top 3 metrics though, don't go crazy right away. You can set them to email you daily or weekly. Way better than drowning in spreadsheets all day.
Dude, start doing cycle counts throughout the year instead of those nightmare annual ones - way more accurate anyway. Most discrepancies happen because someone messed up recording a pick or transfer, so definitely train your team better on that stuff. Also get barcode scanning going for when inventory comes in and update everything right away. Oh, and set up alerts for weird patterns on your dashboard. That thing can actually prevent problems instead of just telling you about them after the fact. Honestly the receiving process is probably where you're bleeding the most accuracy.
Honestly, warehouse dashboards are game-changers for spotting bottlenecks. They pull real-time data on everything - inventory flow, processing times, how your resources are being used. Way better than staring at boring spreadsheets all day. You'll catch problems fast, like if picking is dragging in zone 3 or shipping's backed up again. The visual stuff makes patterns jump out at you. Track your order cycle times and throughput rates to see exactly where things slow down. Oh, and definitely set up alerts for the big bottleneck warning signs so you can fix issues before they mess up your whole chain.
Honestly, I'd hit three big areas: widget customization, role permissions, and industry templates. Let people drag-and-drop their KPI widgets around and pick what shows up on their homepage. Set custom alerts too - that's clutch. Your warehouse manager shouldn't see the same stuff as a picker, so role-based views are pretty much mandatory. Templates for different warehouse types help a ton - e-commerce fulfillment tracks way different metrics than cold storage. Don't go crazy with options though. Start with maybe 5-6 core widgets and build from there, otherwise people get overwhelmed and just stick with defaults anyway.
Think of it like having different keycards for office floors - warehouse guys see inventory numbers, managers get the full reports, admins can actually change stuff. Map out what each person really needs first (this part's kinda tedious but worth it). Then build your permissions around that. Short version: it stops people from accidentally breaking things or seeing sensitive data like supplier costs. Plus you get a nice trail of who touched what when something goes wrong. Your future self will thank you when Karen from shipping can't mess with the system settings anymore.
Gauges for capacity are super helpful, plus color-coded heat maps so you can see which zones are busy. Bar charts work great for throughput too. Your team shouldn't have to dig through spreadsheets to find problems - they need to spot bottlenecks instantly. Traffic lights are perfect for alerts (red = fix this now, green = you're good). Honestly, I'm kind of obsessed with real-time picking velocity charts because they show you immediately if things are flowing or getting jammed up somewhere. Oh, and keep your colors consistent across everything so people don't get confused. Start simple with these basics, then add more later if you need it.
So basically dashboards show you all your compliance stuff in real-time - temp logs, expiry dates, safety reports, whatever you need to track. Super helpful for setting up alerts so you're not panicking when auditors show up (and they always do at the absolute worst moment, I swear). Everything gets centralized - OSHA metrics, FDA requirements, all that jazz. Honestly the best thing is generating reports in like 30 seconds instead of spending your whole afternoon digging through random Excel files. Makes you actually look competent when they come knocking.
Training your team is make-or-break honestly. I've watched warehouses where people just stared at dashboards like they were hieroglyphics, or worse - they'd chase random metrics that looked impressive but meant nothing. Your staff needs to actually understand what those KPIs are telling them and how to fix problems when they spot them. Without that knowledge, you're basically paying for a really expensive screensaver. Start with hands-on training using real situations they'll face every day. Once they get it, you'll see improvements in efficiency almost immediately. Worth the time investment for sure.
-
Best way of representation of the topic.
-
Informative design.
-
Innovative and attractive designs.