


Inventory management dashboard category ppt powerpoint presentation slides graphics example





Try Before you Buy Download Free Sample Product
 Impress Your
 Audience
 100%
100% Editable
 Save Hours
 of Time


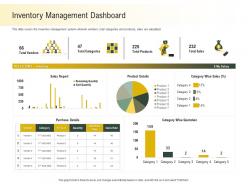
This slide covers the inventory management system wherein vendors, total categories and products, sales are calculated.
People who downloaded this PowerPoint presentation also viewed the following :
Inventory management dashboard category ppt powerpoint presentation slides graphics example with all 2 slides:
Use our Inventory Management Dashboard Category Ppt Powerpoint Presentation Slides Graphics Example to effectively help you save your valuable time. They are readymade to fit into any presentation structure.
FAQs for Inventory management dashboard category ppt powerpoint presentation
Honestly, just track what actually helps you make calls every day. Inventory turnover ratio and stock levels by category are your bread and butter. Days of inventory left is huge too. After that, add stockout frequency and carrying costs - oh, and ABC analysis is seriously underrated for figuring out what to focus on first. Order fulfillment rates and how your suppliers are performing matter too. Keep everything visual with charts and set up alerts when stuff gets dicey. But don't go crazy - stick to 6-8 metrics tops or you'll drive yourself nuts trying to watch everything.
So real-time analytics lets you watch your inventory live instead of checking yesterday's old data. Stock levels, movement patterns, shortages - you see it all happening across locations. Honestly, it's like having superpowers for your supply chain. Problems get caught before they explode into bigger messes. You can adjust reorder points based on what's actually selling, not guesswork. Makes purchasing and distribution decisions way smarter too. Pro tip though - set up alerts for the critical stuff so you're not glued to dashboards 24/7. That gets exhausting fast.
Honestly, the real-time updates are a game changer - no more working with old data because everything syncs automatically as stuff moves around. Your system can actually trigger reorders based on what's really happening, not just wild guesses, which stops you from running out of stock or sitting on too much inventory. I mean, watching it all work together is pretty satisfying. You'll catch problems way faster too since it's all tracked without you doing anything. Oh, and you can spot patterns you'd totally miss otherwise. Start with connecting your POS system first - that's where you'll see the biggest difference right away.
Look, you gotta tailor those dashboard metrics to what actually drives your business crazy. Fashion retail? Track seasonal trends and style lifecycles religiously. Manufacturing folks obsess over raw material lead times instead. Healthcare absolutely needs expiration alerts up front - expired meds are a nightmare nobody wants to deal with. Honestly, most people overthink this part. Just write down your top 5 inventory headaches first. Then set up widgets that show you exactly what's happening with those problem areas in real-time. Your dashboard should solve YOUR specific pain points, not some generic template.
Basically, predictive analytics lets you see what's coming instead of scrambling after problems hit. You can spot seasonal rushes, catch slow sellers, and know about potential stockouts weeks ahead - honestly beats relying on hunches every time. The system crunches your sales history plus market data to give you those early warnings. Cash flow improves because you're not stuck with dead inventory, and customers stay happy since stuff's actually in stock. Oh, and waste drops too which is huge for margins. I'd start with your bestselling products first - way easier to see results that way.
Honestly, visual dashboards changed everything for me - way better than drowning in spreadsheet hell. Heat maps instantly show which products are moving vs sitting there collecting dust. You'll catch seasonal patterns through trend lines that you'd totally miss otherwise. Stockouts? You can spot them coming and set up alerts for when metrics go wonky. I probably spent way too much time manually tracking supplier performance before switching to charts. Quick glance tells you reorder points, bottlenecks, the whole picture. Should've done this ages ago, seriously.
Honestly, the hardest part is always getting your data to play nice together. Most companies have inventory info scattered across like 5 different systems that barely connect. Then there's the people problem - half your team will keep using their crusty old Excel sheets no matter how cool your dashboard looks. I'd say pick one department first and really nail those data connections before going bigger. Oh, and don't try to cram every possible metric onto one screen or you'll just confuse everyone. Get the actual users involved early so they don't hate what you build.
Honestly, having inventory on your phone is a game changer. You can spot problems right when they happen instead of finding out later at your desk that you're out of critical parts. I've watched teams catch shortages just by glancing at their phone while doing warehouse walks - pretty smart if you ask me. Reordering becomes instant, plus you can approve POs and update counts from wherever. The mobile app thing sounds boring but trust me, start checking it during your regular rounds. Way better than being stuck at your computer all day.
Put your most important stuff right up top - stock levels, low inventory warnings, your bestsellers. Don't cram everything on one screen though, seriously some dashboards I've seen look absolutely insane. Red for critical stock, green for good levels - pretty standard color stuff. Your search needs to actually work well since that's where people spend most of their time anyway. Oh and filtering by categories should be dead simple. The whole point is making the data useful, not just something that looks impressive in a meeting. Clean layout beats fancy every time.
Set up your dashboard to auto-calculate turnover rates - just COGS divided by average inventory value. Quarterly tracking works best honestly, monthly gets too noisy. Break it down by product category and SKU so you'll spot the slow movers fast. Create alerts for when rates dip below your targets. First though, figure out baseline rates for your main categories. That way you can actually benchmark stuff and catch problems before they mess with your cash flow. Trust me, catching this early saves so much headache later.
Honestly, inventory dashboards are game-changers for supplier stuff. You get real-time data on who's delivering late, quality problems, stock levels - all that. Makes it super easy to spot which vendors are actually reliable vs the ones always screwing you over. Best part? When you need to renegotiate contracts, you're not just guessing anymore. You've got hard numbers showing exactly how they've performed. I swear, those conversations go so much smoother when you can point to actual metrics. Use the data to strengthen relationships with your good suppliers and fix issues with the bad ones before they tank your business.
Set up automated alerts for when stuff hits your minimum stock levels - trust me on this one. Lead time tracking saves you from those panicky "oh crap we're out" moments. Your dashboard needs to show supplier performance and seasonal patterns, plus ABC analysis for your big-ticket items. Integration with your POS is non-negotiable because manual updates will make you want to quit retail forever. Real-time visibility across locations matters too. Start with reorder points, then add forecasting once you've got that foundation solid.
Dude, seasonal stuff completely changes how you build inventory dashboards. Put time-based patterns right up front - not buried somewhere. Show seasonal velocity changes, year-over-year comparisons, and demand forecasts instead of just "here's what we have now." I got burned on this during holiday season last year, learned my lesson the expensive way! Build widgets for seasonal stock ratios and trend graphs with previous years overlaid. Honestly, the alert system for items that spike during specific periods is a game-changer. Don't make seasonality an afterthought - it needs to be baked into your core metrics from day one.
So basic dashboards give you the obvious stuff - stock levels, low inventory warnings, basic sales numbers. Pretty simple. Advanced ones? That's where it gets interesting. You can do predictive analytics, set custom KPIs, automate reordering, connect everything to your other systems. Honestly the advanced features felt like overkill when I first saw them, but now I can't imagine going back. Forecasting demand, tracking how suppliers actually perform, workflows that pretty much handle themselves. I'd say go basic first if you're just trying to get organized, then move up when you need more control.
Yeah, integrations will totally slow things down - especially if you're pulling from multiple systems at once. It's like your dashboard is trying to juggle five different conversations simultaneously. Load times get worse, and you'll notice lag during busy periods. Honestly, real-time everything sounds cool but it's usually overkill. Try batch updates for stuff that doesn't need to be live, cache what you can, and figure out what actually needs real-time syncing. I'd start by checking your response times first though - gotta know where the bottlenecks are before you fix anything.
-
Very unique and reliable designs.
-
Excellent products for quick understanding.
-
Awesome use of colors and designs in product templates.
-
Qualitative and comprehensive slides.