


Inventory management dashboard sold rate ppt powerpoint presentation diagram graph charts


Try Before you Buy Download Free Sample Product
 Impress Your
 Audience
Editable
of Time


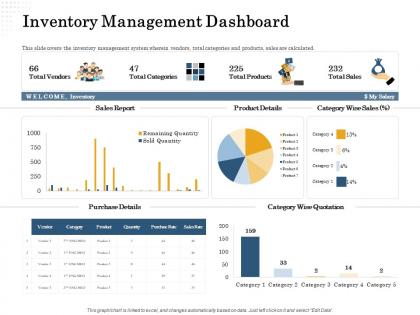
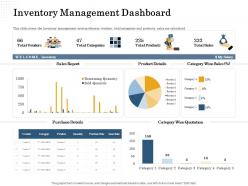
This slide covers the inventory management system wherein vendors, total categories and products, sales are calculated.
People who downloaded this PowerPoint presentation also viewed the following :
Inventory management dashboard sold rate ppt powerpoint presentation diagram graph charts with all 2 slides:
Use our Inventory Management Dashboard Sold Rate Ppt Powerpoint Presentation Diagram Graph Charts to effectively help you save your valuable time. They are readymade to fit into any presentation structure.
FAQs for Inventory management dashboard sold rate ppt powerpoint presentation
Honestly, it's all about finding that sweet spot between having enough stock and not drowning in cash tied up in stuff just sitting there. Get your demand forecasting down first - that's huge. Then figure out your reorder points and do that ABC thing where you rank inventory by importance. Monthly cycle counts beat those nightmare annual ones every time, trust me on that. The biggest thing though? You need solid tracking software and visibility into what's actually moving. Check your turnover rates every month - catches issues early before they cost you serious money. Oh, and don't overthink it at first.
Dude, get yourself a good inventory system that tracks everything in real-time and auto-reorders when you're running low. Barcode scanners are a lifesaver - seriously, who has time to manually count stuff anymore? Make sure whatever you pick connects to your POS and accounting software, otherwise you'll be doing double work. RFID tags are worth it if you've got the budget. Oh, and go cloud-based so you can check inventory from anywhere. I learned this the hard way after spending way too much on overstock last year. You'll probably see payback pretty fast since you won't be constantly out of popular items or drowning in stuff nobody wants.
Honestly, demand forecasting is probably gonna be your biggest nightmare - you'll either have way too much inventory eating your cash or run out right when customers want to buy. Visibility across different locations becomes a mess too. I spent way too many hours wrestling with spreadsheets before I got smart about it! Get some decent inventory software with real-time tracking first. Then focus on data analytics for demand planning and set up automatic reorder points. ABC analysis is clutch for figuring out which products actually matter. Don't try fixing everything at once though - just pick whatever's driving you most crazy and start there.
So basically, inventory turnover shows how fast you're selling through your stock. High turnover = good cash flow and you're not wasting money on storage. Low turnover means your cash is stuck in products nobody wants (ugh, the worst). Each industry's different, but you want enough inventory to keep customers happy without going overboard. I learned this the hard way once - had way too much seasonal stuff that didn't sell. The key is finding that sweet spot where you're not constantly out of stock but also not drowning in unsold inventory.
Oh JIT inventory? Yeah, so you basically order stuff right when you need it instead of stockpiling everything. Saves you tons on storage costs and you won't get stuck with outdated inventory sitting around. Most big companies do this now. Here's the thing though - your suppliers better be reliable because there's no safety net if they mess up. You'll also need solid demand forecasting. Honestly, I'd test it out with your most predictable products first before going all-in. Way less risky that way.
Honestly, demand forecasting is a game changer - you're basically predicting what you'll need instead of winging it. Look at your sales history and seasonal patterns to avoid overstocking random stuff that just sits around forever. Nobody wants those "sorry, we're sold out" moments either. Your carrying costs drop, waste goes down, and customers stay happy. I'd focus on your top 20% of products first since that's where you'll actually see results fast. Historical data plus market trends = way smarter buying decisions. Trust me, it beats guessing every time.
So you'll want to do ABC analysis first - basically just rank your stuff by value so you're not stressing about cheap items that don't move the needle. Set reorder points for everything and check turnover rates monthly. Most people I know just wing this way too long, honestly it's kinda wild. Even a basic spreadsheet works if you don't want fancy software yet. The trick is hitting that sweet spot where you've got enough stock but aren't drowning your cash flow. Oh and definitely block out time each week to actually look at the numbers - otherwise you'll just keep guessing.
So here's the deal with MTS vs MTO - they flip your whole inventory game upside down. Make-to-Stock means you're guessing what people will want and keeping finished stuff sitting around. Higher storage costs, but customers get their orders fast. MTO is totally different - you wait for orders before making anything. Way less finished inventory, but now you're scrambling with raw materials instead. Honestly? MTS forecasting can bite you hard if you guess wrong. I've seen it happen. With MTO you just move that risk to your components pile basically. Figure out what costs you more - holding inventory or making customers wait.
Dude, you'll get way better accuracy with automated systems - like 99% vs the 70-80% you're probably seeing with spreadsheets right now. The time savings alone are insane since everything tracks in real-time and automatically reorders when you're running low. No more manual counts eating up your weekends. It flags problems immediately and actually gives you real data on what's moving instead of just winging it. I'm kinda biased because I've seen too many friends get burned by stockouts, but seriously - the ROI typically covers itself within a year. Worth looking into if you're tired of the Excel nightmare.
Regular audits basically catch all the weird discrepancies before they screw you over. Like, you'll spot patterns in theft or data entry mistakes that would normally slip by unnoticed. This one warehouse I heard about was "losing" tons of inventory just from barcode scanning errors - wild, right? Cycle counts keep your data accurate so you can actually trust the numbers when ordering new stock. Honestly, I'd start with high-value stuff first since that's where mistakes cost the most. Your fast-moving items too.
Track your inventory turnover ratio first - that's the big one for seeing how fast you're moving stock. Carrying costs and stockout frequency matter too. GMROI is honestly a pain to calculate at first but super useful once you get it down. Fill rate and cycle time are worth watching as well. The real trick is looking at these metrics together, not separately. I'd pick maybe 3 or 4 that make sense for your specific business and throw them on a simple dashboard. Something you'll actually look at every week instead of forgetting about it completely.
Dude, seasonal demand totally screws with normal inventory planning. You can't just order the same amounts year-round anymore. Stock up way before busy seasons hit, even though it means more cash tied up and storage headaches. The hardest part? Figuring out exactly how much you'll need. Nobody wants leftover Christmas ornaments sitting around in February - learned that one the hard way. Look at what sold during past seasons and bump up your safety stock. Also, work with suppliers during slow periods for faster turnaround times when you actually need it.
Honestly, it all comes down to nailing your rotation and forecasting. FIFO is everything - first in, first out, no exceptions. Track those expiration dates obsessively because your margins literally depend on it. Try to forecast demand super tight so you don't overorder, and work with suppliers who can do smaller, frequent deliveries instead of huge shipments. Temperature control is obviously crucial. Oh, and have a solid markdown plan for stuff that's about to expire - you'll recover at least some money that way. I'd start by tracking what you're tossing each week though. That waste pattern shows you exactly where you're bleeding money.
So first thing - figure out what rules actually apply to your business. I know it sounds basic but seriously, tons of people mess this up from the start. Get your documentation sorted out properly. Track expiration dates, lot numbers, storage temps, certifications - all that boring stuff that'll save your butt during audits. Do internal audits regularly (way better than having regulators find problems first, trust me). The real trick though? Build compliance into your normal routine instead of scrambling to deal with it later. Makes everything so much easier.
Dude, e-commerce inventory is a total nightmare compared to traditional retail. You've got thousands more products to track, demand that spikes randomly (remember the toilet paper chaos?), and customers expect everything in stock 24/7. Real-time visibility becomes crucial when you're managing multiple warehouses and sales channels. Seasonal planning? Forget about it. Now you need systems that can handle omnichannel fulfillment - someone might buy online but pick up in-store. Automated inventory management isn't optional anymore. Without accurate, real-time stock levels across all channels, you're basically flying blind. It's honestly like juggling while riding a unicycle sometimes.
-
I discovered this website through a google search, the services matched my needs perfectly and the pricing was very reasonable. I was thrilled with the product and the customer service. I will definitely use their slides again for my presentations and recommend them to other colleagues.
-
Unique and attractive product design.