


 0 Comment
 Customer Reviews

Modern-day stores have never been more efficient. From online payments to one-click stock monitoring, our retail businesses are embracing convenience in day-to-day operations.

Stock monitoring, in particular, has been rendered fast and efficient with the use of dedicated stock dashboards. Businesses no longer need a runner to dash through the aisles to check stock availability. Instead, the store’s data is available on a single stock dashboard.
Storekeepers can now track the age of their stock and maintain a real-time record of fast-moving items. Consequently, the stock levels can be adjusted to accommodate both periods of high and low business activity.
A stock dashboard also translates to the reference tool used in planning investments.
Stock Dashboards for Investment
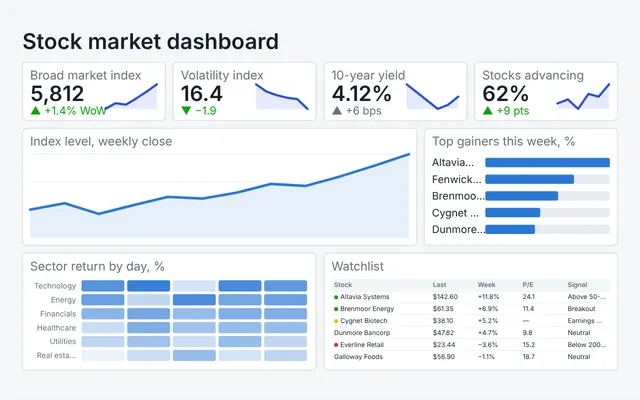
Stock dashboards collect data from sources, including real-time market feeds, news, and company information. This information serves as a ready reference for potential investors to buy and sell stocks at the best available market price.
Whether monitoring goods for a retail store or analyzing market trends for lucrative investments, a detailed stock dashboard impacts profitability, ultimately determining the difference between good and bad decisions. All you need to do is create an organized and informative dashboard with the correct metrics and link it to real-time software.
Stock Dashboard Templates
If you want to forecast profit ahead of the holiday season, you should have a stock dashboard ready to plug in. Such a dashboard, provided it is of the proper format, delivers accurate insights on the parameters that matter. Similarly, if you plan to invest your wealth by purchasing lucrative stocks, you also need a detail-oriented stock dashboard for better decision-making.
SlideTeam is here to take the pressure off your shoulders. With our professionally designed and expert-approved stock dashboard templates, you can simplify tracking and make informed decisions. Additionally, these are content-ready analysis tools to conduct critical monitoring operations. Check out these 100% editable PPT Assets below:
Template 1: Inventory Aging Dashboard To Track Stock Levels
Are you concerned about the value of your warehouse inventory and the duration it has been stored? Obtain a clear overview of stock levels for all sites. You may categorize the stock quantity in ranges to identify the most overstocked and the least.
Moreover, you can highlight the worth of age categories of stocks with this PPT Slide. All of this information can be represented using pie charts and bar graphs for better visualization. Get this stock dashboard template now to compare stocks based on their age and worth!

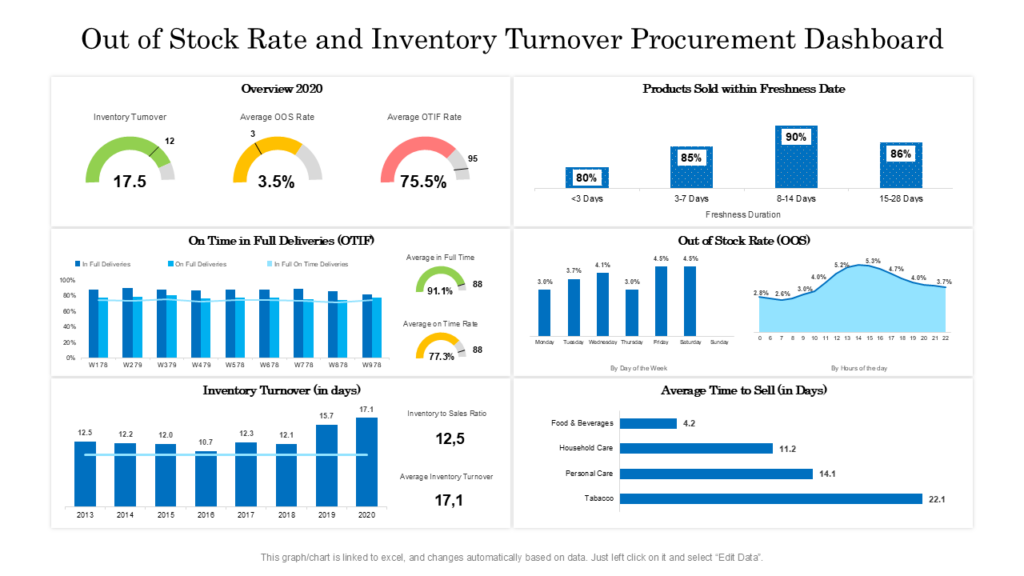
Template 2: Out-of-Stock Rate and Inventory Turnover Procurement Dashboard
Explore our stock dashboard template, which tracks inventory turnover and out-of-stock rates. To achieve this, the stock dashboard template features bar graphs and diagrams to monitor and compare inventory performance, thereby indicating the business's overall health. You can even track the stock sold within the freshness or best-before dates. Similarly, with the same PPT Dashboard, track the average time to sell for elements within your inventory. Get this comprehensive PPT Dashboard now!
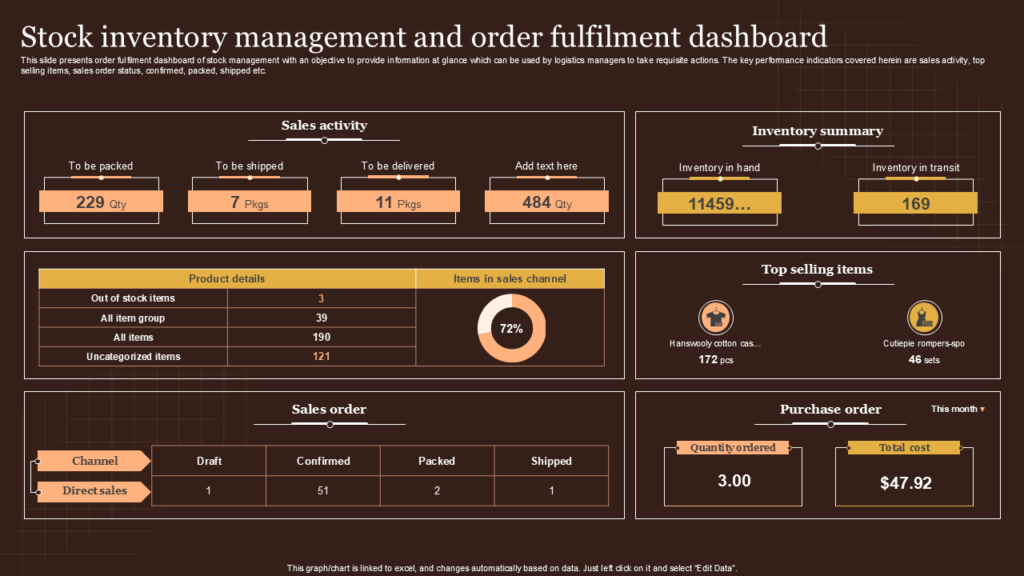
Template 3: Stock Inventory Management and Order Fulfillment Dashboard
Here’s another variation of the stock dashboard template that businesses can use to manage their inventory. Use it to track specific order fulfillment status. Additionally, you can monitor top-selling items and effectively learn how to catalog and manage purchase order details. This Dashboard design employs tables and infographics that can be updated manually or linked to real-time software. Get it now!
Template 4: Inventory and Logistics Stock Quantity and Cost Dashboards
Ensure seamless coordination between your inventory and logistics operations with this dynamic stock dashboard PowerPoint Template. Designed to support strategic decision-making, it helps you monitor stock quality, avoid expired inventory, and manage costs with ease. With visual insights into average unit costs, purchase expenses, and inventory turnover, this dashboard enables you to make informed, data-driven decisions in real-time.

Template 5: Retail Store Dashboard With Stock-Keeping Unit
Monitor your store’s stock activity with this comprehensive Retail Store Dashboard PPT. Track stock availability, incoming inventory, in-transit goods, and preorders—all in one place. Easily record maximum and minimum stock levels to prevent shortages or overstocking, ensuring smooth and uninterrupted operations. Download now to stay ahead of your inventory needs!

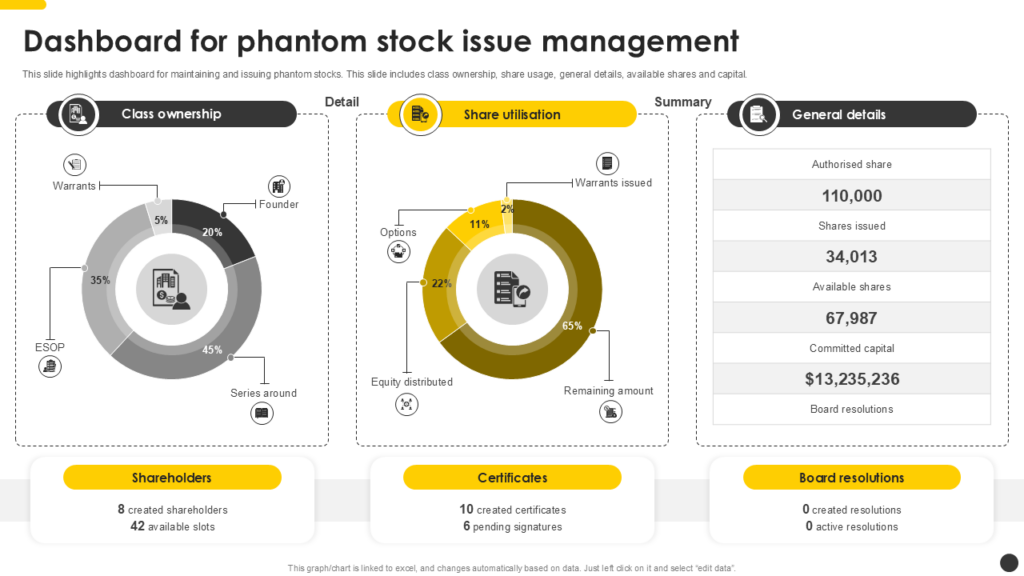
Template 6: Dashboard for Phantom Stock Issue Management PPT Example
Are you looking for a dashboard that can address your phantom stock issues? If yes, then here’s your clue. Check for discrepancies between recorded and actual stock levels as you track root causes and identify patterns that impact inventory accuracy with this PPT Dashboard. This slide will help users streamline issue resolution, reduce stockouts, and improve supply chain visibility. If you want operational precision in retail, warehouse, and inventory teams, this PPT Layout will lead the way.
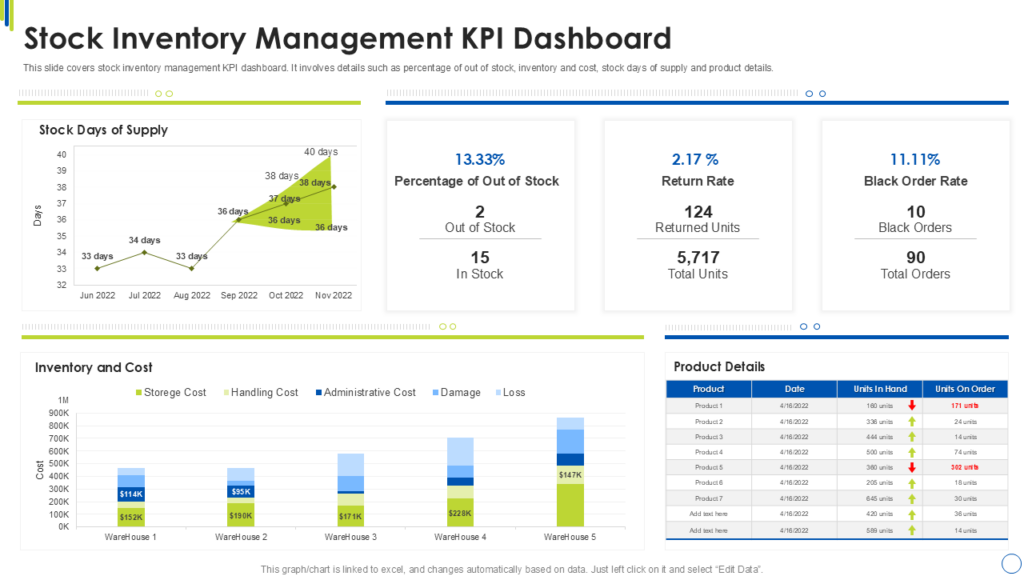
Template 7: Stock Inventory Management KPI Dashboard
Understand your inventory performance with this Stock Inventory Management KPI Dashboard. Track metrics, such as stock on hand, order status, inventory value, and turnover rates—all in one intuitive layout. Your absolute partner in effective decision-making, this PPT template helps you optimize stock levels, reduce holding costs, and streamline warehouse operations. This PPT dashboard is ideal for inventory managers or supply chain team representatives seeking data-driven control.
Template 8: Fundamental Analysis Of Stock Market Dashboard
Analyze market trends with precision using this Fundamental Analysis of Stock Market Dashboard PPT. With its help, it tracks financial indicators like earnings per share, return on equity, P/E ratio, and debt-equity ratio to assess stock performance. Download this graphically enriched PPT Template to help simplify complex data that, in turn, makes evaluating investment opportunities and making informed trading decisions more straightforward.
Whether you’re a beginner or an experienced analyst, investor, or finance professional, you can easily refer to this presentation dashboard to stay ahead in the market.

Template 9: Stock Market Portfolio Dashboard Across Industries
Get this Stock Market Portfolio Dashboard PPT to stay on top of your investments. You can monitor portfolio performance across industries, track stock values, sector-wise allocation, and market trends, and thus make viable investments.
Additionally, this visually engaging slide also simplifies portfolio analysis. Therefore, as an investor or financial advisor, you will have the confidence to make well-informed decisions. Get clarity and execute control over diversified investments with this professional PPT dashboard now!

Template 10: Stock Market Investment Portfolio Management Dashboard
Get this stock dashboard template to track asset allocation, stock performance, risk levels, and returns across multiple portfolios. Whether you’re an investor, analyst, or financial planner, with this PPT Design, you’ll make informed decisions, balance risk, and optimize portfolio growth. Graphically present holdings, net worth, allocation, and transaction trends as you simplify complex data while gaining strategic control over your investment landscape.

Template 11: Manufacturing Company Stock Level Monitoring Dashboard
Ensure a smooth production flow by tracking raw materials, finished goods, and semi-processed items across the various stages of the supply chain with this PPT Dashboard. Monitor stock availability, reorder status, and consumption rates to prevent shortages or overstocking using the same presentation layout.
With easy-to-read visuals and real-time insights, this dashboard also supports efficient planning, reduces downtime, and enhances inventory accuracy. If your objective is to optimize manufacturing efficiency and control costs, this PPT slide is for you.

KEEP YOUR DATA SHARP!
Shun your worries about inaccurate tracking and miscalculated decision-making. Rely on our stock dashboard templates today to keep your data sharp, your decisions smarter, and your savings sweeter.
PS: Confused by terms such as "shrinkage," "internal theft," or "inventory discrepancy"? This blog decodes retail loss and offers templates to tackle it head-on.
FAQs on Stock Dashboards
What is a stock dashboard, and how does it work?
In the retail business, a stock dashboard provides static or dynamic insights into the details of how smoothly your retail operations are running. It tracks the capacity of your product stock, its age, and quality to avoid understocking and overstocking. From an investment perspective, a stock dashboard provides a market overview of opportunities and risks that inform an investor’s decision-making about purchasing or selling stocks for maximum profitability.
How do you build a real-time stock dashboard?
Here’s how to build a real-time stock dashboard:
- Integrate data sources (ERP, WMS, POS)
- Use real-time data connectors or APIs
- Choose a BI tool (e.g., Power BI, Tableau)
- Design KPIs (stock on hand, turnover, reorder levels)
- Implement auto-refresh intervals
- Test for accuracy and performance
- Ensure mobile/device compatibility
What are the key features of an effective stock dashboard?
Here’s what makes an effective stock dashboard. It should:
1. Guide decision-making on the latest inventory information.
2. Track clear metrics, such as stock on hand, reorder levels, turnover rates, and stockouts.
3. Segment stock by product type, location, or status (available, in transit, or reserved).
4. Incorporate charts, graphs, and tables to facilitate quick data interpretation.
5. Flag low stock, expiry risks, or excess inventory.
6. Provide a detailed view, ranging from high-level summaries to SKU-level data.
7. Feature custom filters.
8. Offer mobile accessibility to support decision-making on the go.
9. Seamlessly integrate with ERP, POS, and WMS systems.
10. Have a user-friendly interface