


Fundamental Analysis Of Stock Market Dashboard


Try Before you Buy Download Free Sample Product
 Impress Your
 Audience
Editable
of Time


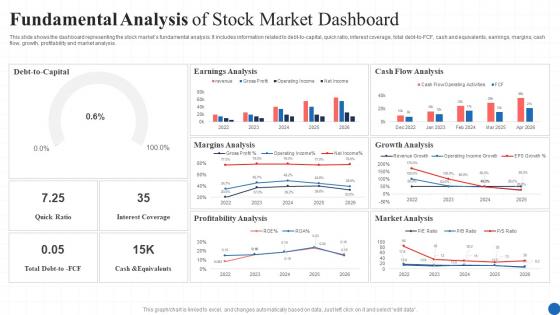
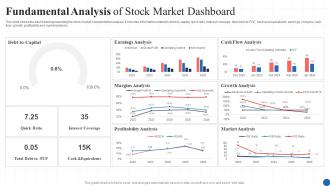
This slide shows the dashboard representing the stock markets fundamental analysis. It includes information related to debt to capital, quick ratio, interest coverage, total debt to FCF, cash and equivalents, earnings, margins, cash flow, growth, profitability and market analysis.
People who downloaded this PowerPoint presentation also viewed the following :
Fundamental Analysis Of Stock Market Dashboard with all 7 slides:
Use our Fundamental Analysis Of Stock Market Dashboard to effectively help you save your valuable time. They are readymade to fit into any presentation structure.


FAQs for Fundamental Analysis Of
Look at the three main statements first - income statement, balance sheet, and cash flow. Income statement shows revenue and profit trends. Balance sheet is like a snapshot of what they own vs what they owe at one point in time. Cash flow is where it gets real though - way harder to fudge those numbers than earnings, so you're seeing actual money moving around. Oh and don't just look at one year, that's pretty much useless. Check out 3-5 years to see if there's any patterns or red flags.
So EPS is basically how much profit a company makes per share - think of it as your go-to metric for tracking if they're actually making money over time. P/E ratio? That's what investors will pay for each dollar of earnings. Shows you what people think the stock's actually worth. When EPS keeps growing, that's usually good news. Just watch for weird one-time events that might inflate the numbers artificially. Low P/E could mean you found a bargain, or maybe everyone's just pessimistic about where the company's headed. Honestly, the best move is comparing these numbers to competitors and looking at the company's track record. That'll give you the real story.
Think of industry analysis as figuring out whether you're investing in a growing pie or a shrinking one. Even amazing companies can get crushed if their whole sector is dying - just look at Blockbuster, honestly. You'll want to dig into growth trends, who the main competitors are, and what regulations might shake things up. Barriers to entry matter too. Is it easy for new players to jump in? Start with industry reports and see how your company stacks up against similar ones. I know it sounds boring, but skipping this step bites people way too often.
GDP growth, inflation, interest rates - all that macro stuff totally changes how your stock analysis plays out. Rising rates can tank growth stocks even when their earnings look great (so annoying). You can't just analyze a company in a bubble though. Like, Tesla might have solid fundamentals, but if the economy's heading into recession, that context matters way more than their quarterly revenue. I always check what's happening with employment data and inflation first. Then I layer in the company-specific stuff. Otherwise you're missing half the picture.
Dude, management quality matters SO much in stock analysis. Bad leaders can totally wreck even solid companies - just look at WeWork's disaster. I always check their track record first, then how they spend company money and communicate with investors. Red flags? Crazy executive bonuses, constantly changing strategies, or making promises they never keep. Their annual shareholder letters are actually pretty revealing - you can tell if they're straight shooters or just blowing smoke. Honestly, sometimes I spend more time researching the CEO than the actual business model.
Look, dividend yields tell you what cash you're getting back compared to the stock price. High yields can be awesome for income, but sometimes they're high because the stock crashed - which obviously isn't great. I always check how it compares to similar companies first. The payout ratio matters too because some dying companies keep paying dividends they honestly can't afford. Don't just chase the biggest yield though. Consistency is way more important than one flashy number, and companies that gradually increase their dividends over years? Those are the real winners.
Revenue growth rate is what I always check first - it's like the foundation of everything else. Then I dig into EPS growth, ROE, and free cash flow over 3-5 years minimum. P/E ratios honestly trip up so many people because they're pretty useless for growth companies. Profit margins are huge too - you want to see if they're actually expanding as the company gets bigger. I always compare against competitors in the same space, and forward guidance matters way more than people think. Oh, and don't get caught up in quarterly noise - focus on the longer trends. Those metrics will tell you if it's real growth or just hype.
Honestly, the numbers only tell half the story. I'd dig into who's actually running the company - check out their track record and listen to a few earnings calls to see if they sound like they know what they're talking about. Look for competitive advantages too, like strong brand loyalty or high switching costs that keep customers stuck. Industry trends are huge - is the whole sector getting disrupted or facing new regulations? Sometimes this qualitative stuff matters way more than perfect financials. I usually score these factors 1-5 on a simple scorecard, then factor that in with the financial metrics. Makes decisions way clearer.
Economic cycles mess with stock analysis big time. Companies look amazing during booms - earnings up, revenue crushing it - but half the time they're just surfing good times. Recessions crush most fundamentals, though weirdly some boring defensive stocks actually do fine. P/E ratios become total liars depending on cycle timing, which honestly drives me crazy. I'd focus on normalizing earnings across full cycles instead. Look for companies that don't completely fall apart when things get rough. Way more reliable than chasing whatever's hot right now.
Look at 5-10 years of data, not just recent quarters. You'll see actual patterns in revenue, margins, debt - stuff that repeats across business cycles. Way better than getting fooled by one good year, you know? Check if management actually delivers on what they promise over time. Seasonal trends become obvious too. I always cross-reference historical data with current fundamentals - it's like fact-checking the story the numbers are telling you. Some companies look great now but their track record is garbage. Others are boring but super consistent performers.
So competitive analysis is basically what gives your research actual context - you can't just look at a company's numbers alone and know if they're good or bad. Pick their top 3-4 competitors and compare the important stuff: profit margins, market share, growth, debt levels. That's how you figure out if your company is crushing it or getting crushed. Honestly, this step saves you from thinking mediocre numbers are amazing just because they look decent on paper. You'll spot who has real pricing power and competitive advantages. Plus it highlights red flags that aren't obvious when you're analyzing solo.
Bloomberg's the holy grail if your company pays for it, but it's crazy expensive. Yahoo Finance and Morningstar have decent free data for fundamentals. Excel is still king for building your own models - I probably spend way too much time in spreadsheets honestly. FactSet and Refinitiv are solid paid options too. Finviz and Stock Rover are lifesavers for screening companies fast by metrics. Don't overthink it though. Start with the free stuff, figure out what you actually use, then maybe upgrade later.
Dude, you literally can't value a company if you don't get how it makes money. Read their annual report first - the business section usually spells it out pretty clearly. Once you understand their revenue streams and costs, predicting cash flows becomes way easier. It's like... imagine trying to bet on a sports team without knowing the rules of the game, right? Different industries need different metrics too. A tech company's numbers will look totally different from a retailer's. Knowing the business model helps you figure out which red flags actually matter for that specific type of company.
Look, fundamental analysis is solid but it's got some serious timing issues. You might nail the math on a stock's real value, but markets can stay crazy way longer than you'd expect. Just look at how long GameStop stayed pumped up - fundamentals said one thing, reality said another. The whole approach relies on old data too, while stock prices are basically betting on the future. Sentiment and panic moves? Good luck predicting those with balance sheets. I'd mix it with some technical stuff and don't expect perfect timing.
Dude, biases totally screw with reading fundamentals even when the data's rock solid. Like you'll cherry-pick numbers that confirm what you already think, or get stuck on some old price target that doesn't make sense anymore. Overconfidence is brutal - makes you ignore stuff that contradicts your thesis. Recent earnings always feel way more important than they actually are too. Honestly, I do this crap all the time. Best fix is having actual systems. Make checklists, talk to people who disagree with you, question your own assumptions regularly. Oh and decide your buy/sell rules before you start analyzing so your emotions can't mess everything up.
-
Definitely a time saver! Predesigned and easy-to-use templates just helped me put together an amazing presentation.
-
SlideTeam’s readymade presentations have landed my unique images with my bosses in the past and it continues to reward me.