

Private Equity Investment Portfolio Performance Dashboard





Try Before you Buy Download Free Sample Product
 Impress Your
Audience
 100%
Editable
 Save Hours
of Time


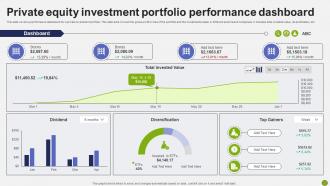
This slide covers a performance dashboard for a private investment portfolio. This slide aims to track the gross profit or loss of the portfolio and the investments made in different sectors and companies. It includes total invested value, diversification, etc.
People who downloaded this PowerPoint presentation also viewed the following :
Private Equity Investment Portfolio Performance Dashboard with all 7 slides:
Use our Private Equity Investment Portfolio Performance Dashboard to effectively help you save your valuable time. They are readymade to fit into any presentation structure.






FAQs for Private Equity Investment
IRR and MOIC are the big ones - they'll show you actual fund performance pretty clearly. Most people also track TVPI and cash flow stuff like distributions to paid-in capital. Portfolio companies get measured on revenue growth, EBITDA margins, debt ratios, the usual suspects. Honestly though? There's always a mountain of data nobody ever actually uses. I'd focus on IRR and MOIC first since your LPs will definitely ask about those, then add whatever operational metrics matter most to your investors. Don't get lost in the weeds with every single ratio - half of them won't tell you anything useful anyway.
Dude, visualization tools are honestly a lifesaver for PE analysis. Instead of staring at endless spreadsheet rows, you get actual charts and dashboards that make sense. Heat maps show you which sectors are crushing it, timeline charts reveal vintage year trends - way easier to spot the dogs in your portfolio. Power BI or Tableau work great for this stuff. You can set up dynamic filters too, like drilling down by geography or deal size. I probably spend half the time I used to just finding the patterns. Start simple with your top 10 holdings and see how their performance looks visually.
Honestly, your PE dashboard is only as good as the analytics behind it. Think about what decisions you actually need to make first, then figure out what data supports those choices. Track real performance metrics and trends across your portfolio - not just stuff that looks impressive in meetings. Good analytics help you catch problems early instead of scrambling later. I've seen too many dashboards that are basically expensive eye candy because they're measuring the wrong things. Focus on KPIs that'll actually influence your investment decisions. Otherwise you're just staring at pretty charts nobody trusts.
Honestly, PE dashboards are game-changers for tracking where your deals actually stand versus where they should be. No more drowning in spreadsheets (thank god). The timeline view lets you catch delays before they spiral, plus you get alerts when milestones are coming up or already blown. I'd set mine up to show both the big picture across your whole portfolio and individual deal progress. That way you know exactly where to focus your energy. My buddy swears by the bottleneck identification feature - apparently saved him from a nasty surprise last quarter.
Look at four main things: revenue growth, EBITDA margins, cash flow, and debt-to-equity ratios. Those'll give you the best snapshot of how healthy things actually are. Customer acquisition costs and retention rates are huge too - they're like canaries in the coal mine. Revenue quality is just as crucial as the numbers themselves, so check if it's recurring or just one-off stuff. Honestly, I'd set up alerts for when any of these trend down for two quarters straight. That way you can jump in before everything goes sideways. Oh, and don't get too caught up in perfect dashboards - sometimes the messy data tells the real story.
Honestly, dashboards are a game changer for investor relations. Instead of those massive slide decks that put everyone to sleep, you get clean visuals that tell the actual story. Real-time updates mean when someone asks about IRR mid-call, you're not frantically digging through emails. Everything's right there - portfolio performance, fund metrics, deal flow. The visual format just makes complex stuff way easier to understand, which is huge when you're dealing with LPs who don't have time for nonsense. Set up automated quarterly reports and you'll save yourself tons of time while looking way more professional.
Don't cram everything onto one screen - it just overwhelms people and kills your key insights. Mixing data sources or time periods across sections is another killer mistake. Makes everything confusing and nobody trusts your numbers. Oh, and double-check those IRR calcs (trust me on this one). Static dashboards are pretty useless too. Users need to drill down into portfolio companies and mess with timeframes. Honestly, just pick 5-7 metrics that actually matter for decisions. I know it's tempting to show off all your data, but resist that urge.
Your dashboard needs to shift with whatever's happening in the markets right now. Rising rates? Focus on debt metrics and covenant tracking. ESG getting hot? Add those sustainability numbers. I swear we're always playing catch-up with trends, but that's just how it goes. Tech disruption means you need sector rotation stuff too - can't ignore digital transformation indicators anymore. The key thing is building flexibility so you're not stuck with static returns when everything changes. You'll want to pivot fast when the next market shift comes, and trust me, it always does.
Honestly, most PE shops I know are obsessed with either Tableau or Power BI for custom stuff. Juniper Square and 4Degrees are decent if you want the investor relations features already baked in. Python with Streamlit is pretty sweet if you're technical - gives you way more control. Excel works fine for smaller funds but gets ugly real quick with complex portfolio data. Actually, my buddy's fund still runs everything in Excel and it's... not pretty. Start by figuring out which KPIs you actually need to track, then just pick whatever tool handles those without making your life hell.
Just add dedicated ESG sections to track the usual stuff - carbon footprint, energy usage, diversity metrics, community investment, board composition, exec comp transparency. Most PE firms pull this quarterly from portfolio companies now (honestly it's pretty much expected at this point). Visual scorecards work great, or try heat maps that sit right next to your financial metrics. You'll start seeing patterns between ESG performance and returns. Pick maybe 3-5 ESG KPIs that actually align with your fund's focus first - don't go crazy trying to track everything at once.
Look, different people need totally different info from your dashboard. LPs just want the big picture stuff - performance numbers and fund summaries. Your investment team? They're digging into deal specifics and operational data all day. Portfolio execs only care about their own company's metrics, honestly. Without customization, you'll either drown people in useless data or leave them hanging without what they actually need. It's kinda like giving everyone the same tool when they're doing completely different jobs. First thing I'd do is figure out what each group actually uses the dashboard for, then build from there.
Okay so the dashboard basically shows you real-time numbers on all your portfolio companies - revenue growth, EBITDA margins, debt ratios, all that stuff. It's super helpful for figuring out when to exit because you can spot those sweet timing windows when everything's looking good. You can also compare against market data and see what's happening industry-wide (honestly feels like cheating sometimes). The modeling part is clutch too - you'll be able to run scenarios for IPOs, strategic sales, whatever. I mean, my buddy just used his dashboard data to put together killer investment memos that helped bump their valuation by like 20%. Worth it.
Honestly, automate your data validation first - catches way more errors than you'd think. Set up those reconciliation checks between sources and your dashboard because manual entry will absolutely screw you over at some point. Document how you calculate everything so there's no confusion later. Also, pick one source of truth per metric and stick to it. Version control becomes critical when you're dealing with updated valuations. I'd start by looking at where your data flows now and figuring out the usual trouble spots. Those inconsistencies always have patterns if you dig into it.
Monthly updates work for most stuff, but I'd do weekly check-ins on cash flow and deal pipeline since those move constantly. Quarterly deep dives make sense for portfolio valuations - that's where you really dig into performance. Honestly, daily tracking feels overkill unless you're in the middle of something urgent. Market conditions change overnight but your portfolio companies' financials don't, so match your update schedule to what's actually shifting. I'd start everything monthly then tweak from there based on what you're using for decisions. Oh and your team will probably have opinions on this too.
For financial stuff, aim for 15-25% IRR depending on your fund's focus and vintage year. MOIC matters too since timing is everything in PE. Operational metrics are where it gets interesting though - track revenue growth, EBITDA margins, debt ratios for each portfolio company. The real pain is collecting consistent data from everyone. Seriously, half your companies will send you random Excel files that don't match anything. Build standard reporting templates early and compare against Cambridge Associates or Preqin benchmarks. Makes your life way easier down the road.
-
The designs are super attractive. Me and my team love using SlideTeam’s presentations.
-
I discovered this website through a google search, the services matched my needs perfectly and the pricing was very reasonable. I was thrilled with the product and the customer service. I will definitely use their slides again for my presentations and recommend them to other colleagues.