

KPI Dashboard To Measure Investment Portfolio Growth





Try Before you Buy Download Free Sample Product
 Impress Your
Audience
 100%
Editable
 Save Hours
of Time


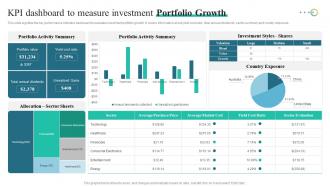
This slide signifies the key performance indicator dashboard to evaluate investment portfolio growth. It covers information about yield cost ratio, total annual dividends, sector summary and country exposure.
People who downloaded this PowerPoint presentation also viewed the following :
KPI Dashboard To Measure Investment Portfolio Growth with all 7 slides:
Use our KPI Dashboard To Measure Investment Portfolio Growth to effectively help you save your valuable time. They are readymade to fit into any presentation structure.






FAQs for KPI Dashboard To Measure
Honestly, start simple with like 5-7 metrics that actually matter to your team. Use colors that make sense - red/yellow/green works because people get it instantly. Real-time data is clutch, but don't stress if it's slightly delayed. You'll want to drill down when numbers look weird (and trust me, they always will). Trend lines are super helpful - way better than just seeing today's snapshot. Oh, and resist cramming everything on one screen even though it's tempting. Clean beats comprehensive every time. Build it out gradually based on what people actually click on, not what you think they should care about.
Clean layouts with lots of whitespace are your best friend here - they cut down on mental clutter. Consistent color coding helps too, but honestly, I see so many dashboards that look like a bag of Skittles exploded. Keep it simple. Size and positioning should guide your eye to the most critical stuff first. Match your charts to the actual data type you're showing. The whole point is making it so obvious that your team can glance at it and immediately know if something's off or trending well. Quick recognition beats pretty colors every time.
You gotta pick KPIs that actually matter for your industry. Retail? Look at conversion rates and customer lifetime value. Manufacturing is all about efficiency - OEE, defect rates, that stuff. SaaS companies obsess over MRR and churn rates (honestly, they can be a bit intense about it). Figure out what really drives success in your sector first. Then grab 3-5 metrics that directly track those things. Don't fall for vanity metrics that look cool but won't move the needle. Here's the thing - your team needs to actually control these numbers through what they do every day, otherwise you're just making dashboards nobody looks at.
Weekly updates work for most dashboards, but it really depends on your situation. Sales teams might need daily refreshes since things move so fast. Monthly strategic stuff? Weekly's totally fine. The worst thing you can do is let your data get stale - people will just stop looking at it if the numbers are obviously outdated. I've seen too many dashboards become glorified wallpaper because of this. Start with weekly and see how often your team actually checks it. If they're looking daily but seeing week-old data, bump up the frequency. You'll figure out the sweet spot pretty quickly.
Honestly? Start with Google Data Studio since it's free and way better than it used to be. Tableau's the gold standard for fancy visualizations but costs a fortune. Power BI works great if you're already stuck in Microsoft land. There's also Looker and Qlik Sense, though I haven't messed with those much lately. You could even build something custom in Python or R if your team's into that. Really comes down to budget and how tech-savvy everyone is. I'd play around with the free option first, see what you actually need, then maybe upgrade later.
So basically, leading KPIs tell you what's coming (stuff like pipeline activity or web traffic) while lagging ones show what already went down - your revenue, churn rates, whatever. I'd put the leading indicators right at the top of your dashboard since those are what'll actually make your team do something. Then stick the results underneath. Oh and definitely use different chart styles - real-time stuff for the predictive metrics, maybe just simple cards for the historical data. You want people to quickly spot both where they're headed and how they did. Makes way more sense than jumbling everything together.
So basically you want to match the dashboard to who's actually using it. C-suite folks just need the big picture stuff - trends, strategic metrics, that kind of thing. Middle management wants to see departmental numbers they can actually do something about. And your front-line people? Give them the operational stuff that affects their daily grind. Nobody's got time for data that doesn't matter to them. Oh, and definitely ask each group what decisions they're trying to make first - way easier to work backwards from there. You can mess with refresh rates and drill-down options too depending on how they use it.
Honestly, looking at endless spreadsheet rows is brutal - your brain just can't process all those numbers quickly. Charts and graphs are lifesavers because you'll instantly see trends, weird outliers, and patterns that would take forever to catch otherwise. Dashboards make comparing metrics so much easier too. You can spot when things are heading south or figure out what needs fixing right away. Oh, and pick the right chart type - bar charts work great for comparisons, line graphs for tracking stuff over time. Way better than drowning in raw data.
First thing - figure out your data sources and make sure they're actually clean. Don't use that ancient spreadsheet Karen's been updating since 2021, you know the one. Set up validation rules that catch weird outliers before they mess up your dashboard. Monthly audits are a lifesaver too, just cross-check the numbers against your original systems. Oh, and definitely limit who can change stuff - too many cooks and all that. Document how you calculate each KPI because you'll forget in like two months and then your boss will ask questions. Seriously, write it down now while it's fresh.
Don't cram everything onto one screen - it's overwhelming as hell. Also make sure your KPIs actually matter to the business, not just random vanity metrics that look pretty but tell you nothing useful. Speed matters too because slow dashboards drive everyone crazy. Clean design is key so people can actually read the thing without squinting. Oh, and this is probably obvious but refresh your metrics regularly - I've seen too many teams still tracking stuff that stopped being relevant months ago. Honestly the worst dashboards are the ones that look impressive in meetings but nobody ever uses for real decisions.
So here's the thing - real-time data integration actually makes your KPI dashboard worth using instead of just being wall decoration. You can catch problems the second they happen rather than finding out about disasters a week later. Honestly, I've watched way too many teams build these gorgeous dashboards that nobody trusts because the data's always outdated. When everything updates automatically, your team will actually believe what they're seeing. You'll spot trends early and fix issues before they explode into bigger messes. My advice? Start with your most critical data sources first - trying to connect everything at once is a nightmare.
Honestly, dashboards are game-changers because you can see what's actually happening instead of just guessing. Problems show up before they blow up, which has saved me so many headaches. The visual stuff makes it way easier to explain things to your boss or team too. Real-time data means you catch trends and weird bottlenecks you'd totally miss otherwise. Oh, and definitely set up alerts for your biggest metrics - trust me, you don't want to become one of those people refreshing dashboards every five minutes like it's Instagram. Makes decision-making so much cleaner when everything's right there.
Track survey scores, retention rates, and how often people actually show up to work - those are your basics. Pulse surveys beat annual ones by miles since you get real-time feedback instead of stale data. Also watch training completion rates and employee referrals (people only refer friends to places they actually like working). Set up automated feeds so your dashboard updates itself - trust me, you don't want to pull this stuff manually every month. I'd start with maybe 3-4 metrics, see what actually moves the needle for your team, then add more later.
Honestly, focus on metrics that actually matter for revenue - not just pretty traffic numbers. Cost per lead and conversion rates are your bread and butter. Track your funnel performance too: website visits, email opens, social engagement. ROI is obvious but here's what people always mess up - attribution tracking. Like, which channels are actually bringing in customers? It's annoying to set up but so worth it. Pick maybe 5-6 metrics max or you'll go crazy trying to track everything. I'd automate reports so you're not scrambling when someone asks for numbers.
Pick 3-5 metrics that actually matter to your company first - energy use, waste reduction, carbon output, water consumption. Track stuff like kilowatt hours per product or how much recycled material you're using. Honestly, making it visual is huge because nobody wants to dig through endless spreadsheets. Your stakeholders will actually look at charts and graphs. Update monthly or quarterly depending on what makes sense for your timeline. Oh, and don't go overboard at the start - you can always add more metrics later once you've got the basics down.
-
I joined SlideTeam last month and there’s no doubt that I tend to find our bond only strengthening over time. Best place to find world-class themes, templates, and icons.
-
“Immediate response, professional support, and effective solutions that were customized and immediately provided. Well done- Thank you!”