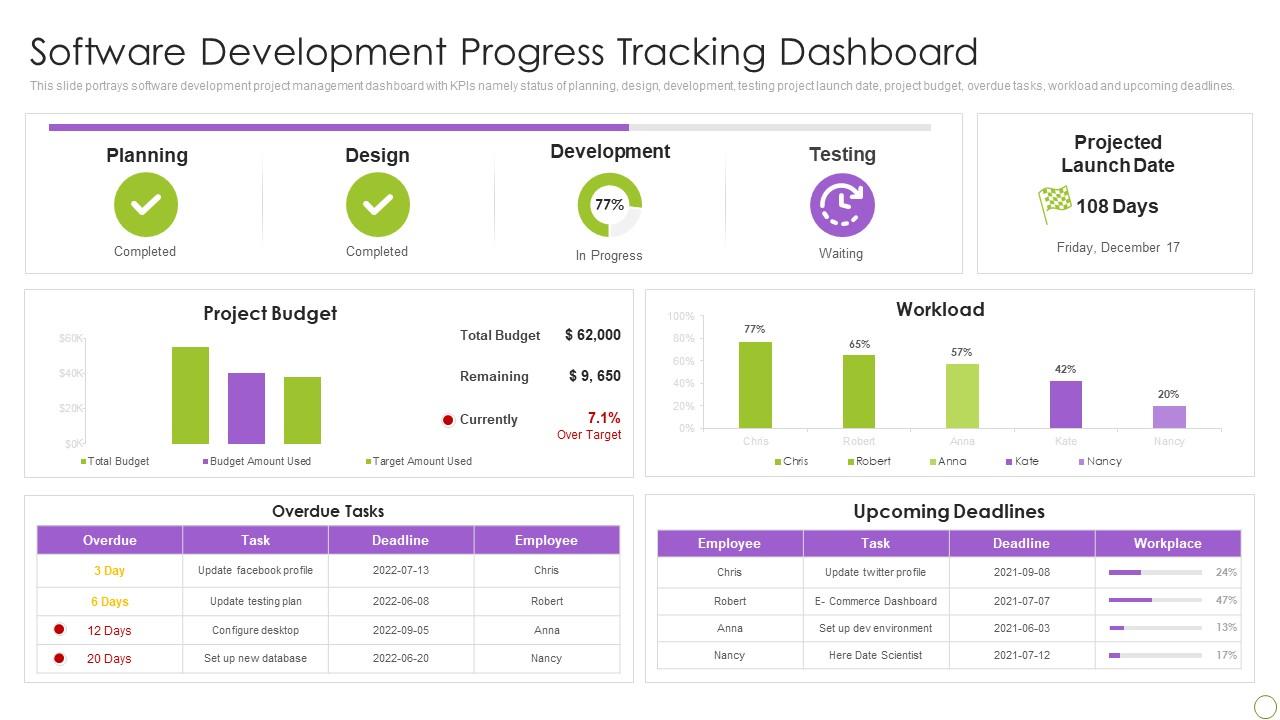
Software Development Progress Tracking Dashboard

Rating:
90%
Software Development Progress Tracking Dashboard
Slide 1 of 7

or

Favourites Favourites

Try Before you Buy Download Free Sample Product

Audience Impress Your
Audience
Editable 100%
Editable
Time Save Hours
of Time
The Biggest Sale is ending soon in
0
0
:
0
0
:
0
0
Rating:
90%
Present the topic in a bit more detail with this Software Development Progress Tracking Dashboard. Use it as a tool for discussion and navigation on Planning, Design, Budget, Development. This template is free to edit as deemed fit for your organization. Therefore download it now.

FAQs for Software Development

Start with velocity and deployment frequency - those'll give you the best baseline. Cycle time is honestly my favorite metric because it shows you exactly where stuff gets stuck. Lead time from idea to production matters too, obviously. Bug escape rate will keep you honest about quality. I'd probably add code coverage and mean time to recovery since things always break eventually. Customer satisfaction scores are gold if you can actually get them from users. But seriously, pick like 3-4 metrics max that match what your team's trying to fix right now. Otherwise you'll just drown in dashboards nobody looks at.

Dude, charts are a lifesaver for making sense of all those metrics. Like, who wants to dig through endless spreadsheets when a simple graph shows you everything? You'll spot issues way faster - sudden drops in deployments, technical debt creeping up, whatever. Burndown charts work great for sprints, heat maps show code complexity (those are actually pretty cool), and velocity charts track how your team's doing. Honestly, half the battle is just picking the right visual for what you're trying to fix. Makes problems super obvious instead of buried in data.

Put the stuff that matters most right at the top - build status, any incidents, deployment health. Your team shouldn't have to hunt for the critical info. Group similar things together and stick to basic colors (red = bad, green = good). I swear, half the dashboards I've seen look like someone just threw widgets at a wall. Keep it clean so people can actually scan it quickly. Don't try cramming everything onto one screen - that never works. Test it with your teammates and watch where they look first. If they're squinting or getting lost, you need to simplify.

So basically real-time data integration means your dashboard actually shows what's happening right now instead of yesterday's old stuff. Instant visibility into build failures, deployments, team velocity - no more waiting around for manual updates. Honestly it's pretty huge because you catch problems before they turn into disasters. Your team jumps on blockers immediately, stakeholders see current progress (not stale metrics), and you skip those awkward "uh, lemme double-check those numbers" moments during standups. Oh and definitely start with automated feeds from your CI/CD pipeline and project tools first - that's where you'll see the biggest impact.

Honestly, I'd go straight for **Grafana** - it's free and connects to basically everything. Most dev teams I know use either that or **Kibana**. **Datadog** and **New Relic** are pretty nice if you've got budget, but their free tiers might be enough to start. You could try **Tableau** but it feels way too heavy for just dev metrics tbh. With Grafana you can literally pull data from your Git repos and CI/CD stuff in like an hour. Super flexible too - I've seen people build some crazy custom dashboards with it. Start there and see how it feels.

You'll want to nail three key things: automated validation, single data sources, and regular audits. Set up rules that catch weird stuff like negative story points or impossible timestamps - seriously, those edge cases will wreck your metrics before you know it. Always pull from one source of truth (your PM tool or Git) instead of mixing systems. I do weekly spot checks comparing dashboard numbers to the actual tools, catches integration problems fast. Oh and document how you calculate everything so your team isn't guessing what metrics actually mean.

User feedback is your reality check - without it, you're just guessing. I've watched teams build gorgeous dashboards that nobody actually uses because they never asked what people needed. Developers can't find bottlenecks, managers don't get sprint progress - total mess. Get feedback early through surveys or just grab people for quick chats. Honestly, the casual conversations often give you the best insights. Focus on the pain points that come up most and fix those first. Don't overthink it - iterate fast and keep asking what's broken.

Honestly, dashboards are game-changers for keeping everyone on the same page. No more awkward "wait, who's doing what?" moments during standups. You'll see sprint progress and blockers right away, plus code review status - saves tons of time. Stakeholders can actually check things themselves instead of bugging you every five minutes (which is amazing). Set up notifications for the critical stuff so your team stays updated without drowning in meetings. It becomes this shared hub where everyone knows the real priorities and deadlines. Trust me, once you have it running smoothly, you won't go back.

Honestly, the worst mistake is shoving like 20 different metrics on one screen. You'll just overwhelm everyone instead of helping them make decisions. Stick to maybe 5-7 things that actually matter - deployment frequency, lead time, bug counts. Skip the vanity metrics that look cool but don't change how your team works. Oh, and don't build it once and forget about it. These things get outdated super quick if no one's maintaining them. Keep the language simple too - your PM doesn't need to decode a bunch of technical jargon just to understand what's happening.

Honestly, dashboards are a game-changer for tracking technical debt. You get real-time metrics on code complexity, test coverage, outdated dependencies - all in one spot. The visual trends are clutch when you need to convince management that refactoring isn't just "nice to have." Set up alerts for complexity thresholds so you're not dealing with disasters at 2 AM (been there, done that). Plus seeing how debt actually impacts your deployment speed and bug rates makes the whole thing way more concrete. Way better than just guessing which parts of your codebase are about to implode.

Responsive design is your starting point - the dashboard has to work smoothly across different screens. Make buttons and clickable stuff big enough for actual fingers, not tiny mouse clicks. I can't tell you how many mobile dashboards I've used that are basically broken because everything's microscopic. Since you're working with limited screen space, focus on your most important metrics for the mobile version. Maybe add some swipe gestures to move between sections? That feels pretty natural on phones. Loading speed matters more on mobile too since connections aren't always great. Figure out the top 3-5 things your team actually needs to do on mobile and build around those scenarios.

Talk to each person first - figure out what they actually care about day-to-day. Devs want build status and bug counts right up front. PMs need sprint progress and resource stuff. Executives just want the big picture KPIs (honestly, they tune out if there's too much detail). Most dashboard tools let you customize views by role anyway. The key is asking "what questions are you trying to answer when you check this?" Then build around that. Don't dump everything on everyone - nobody has time for that noise.

Honestly, the coolest stuff happening right now is real-time collaboration and predictive analytics that don't suck. Most teams are ditching those basic velocity charts for dashboards that plug right into CI/CD and flag deployment risks upfront. AI insights are finally getting useful too - like actually spotting code quality issues and team bottlenecks instead of just being marketing fluff. The whole game's shifting from reactive to proactive metrics, which is huge. Quick test: does your current dashboard help you catch problems early, or just tell you what already went wrong? That's probably where you should start.

Honestly, dashboards changed everything for our sprints. You get instant visibility into burn-down charts and can spot blocked stories before they mess up your timeline. Makes standups so much smoother since everyone sees the current state right away. Your stakeholders will love checking progress themselves instead of pinging you every five minutes - trust me on this one. Real-time tracking of team velocity is clutch too. Oh, and set up those automated reports for burn-down trends. Saves you from writing the same status updates over and over.

Dude, automation will save your life. No more manually pulling data from five different tools every week - it just grabs everything automatically. Commit stats, build rates, deployment metrics, all of it. Your dashboard updates in real-time so you're not constantly scrambling before meetings. Plus no more spreadsheet typos (we've all been there). I'd start with whatever report takes you the longest right now - probably that weekly thing everyone keeps asking about. Once stakeholders see current data instead of last week's numbers, they'll actually trust your dashboards. Honestly wish I'd done this way sooner.

Ratings and Reviews

90% of 100
Review Form
Write a review
Most Relevant Reviews
  1. 80%

    by Devon Ferguson

    Visually stunning presentation, love the content.
  2. 100%

    by Duane Ray

    Awesomely designed templates, Easy to understand.

2 Item(s)

per page: