


Software Development Dashboard With Project Health Metrics




Try Before you Buy Download Free Sample Product
 Impress Your
 Audience
 100%
100% Editable
 Save Hours
 of Time


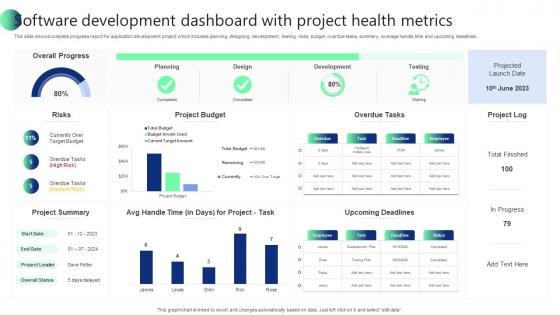
This slide shows complete progress report for application development project which includes planning, designing, development, testing, risks, budget, overdue tasks, summery, average handle time and upcoming deadlines.
People who downloaded this PowerPoint presentation also viewed the following :
Software Development Dashboard With Project Health Metrics with all 7 slides:
Use our Software Development Dashboard With Project Health Metrics to effectively help you save your valuable time. They are readymade to fit into any presentation structure.






FAQs for Software Development Dashboard With
Start with velocity and lead time - those two will tell you the most right off the bat. Deployment frequency matters too, plus how long it takes from code commit to actually shipping. Don't sleep on code quality stuff like test coverage and bug rates, though honestly 100% coverage is kinda overrated. Cycle time for individual tasks is solid. Oh and if you can get team happiness scores, do it - grumpy developers write worse code. Keep it to maybe 5-7 metrics max or you'll drown in data. You can always layer on more once you've got the basics dialed in.
Honestly, dashboards are a game changer for dev teams. You get real-time updates on sprints and can actually see who's drowning vs who has time to help. No more digging through Slack threads trying to figure out what's happening (the worst!). Your stakeholders stop bugging you every five minutes asking for status updates since they can just check themselves. Bottlenecks become obvious before they derail everything. The best part? Everyone's looking at the same info, so there's way less "wait, I thought we agreed on X" confusion. Set up some automated reporting first - trust me, you'll wonder how you lived without it.
Honestly, keep it simple - your dashboard needs to tell a story without making people squint at tiny numbers. I always group related stuff together and stick to basic charts (bar graphs beat those fancy donut things every time). Don't cram everything onto one screen - I've debugged way too many "Christmas tree" dashboards that nobody actually uses. Start with maybe 3-5 metrics that your team checks daily, like deployment frequency and failure rates. Put the most critical data where you can see it immediately. Consistent colors help too, though that's probably obvious. You can always add more later based on what people actually click on.
Look, real-time integration is what separates useful dashboards from fancy decorations. Your metrics pull directly from Git, CI/CD, and issue trackers - so you catch problems as they're happening. No more awkward post-mortems where everyone's like "wait, when did this break?" Failed builds? You'll know instantly. PR reviews piling up? It's right there. Features dragging longer than planned? Yep, visible immediately. The trick is hooking it up to whatever tools your team's already living in daily. Trust me, nobody wants another system to remember updating manually.
Your CI/CD pipeline is where most of your dashboard data comes from, so connect that first. Every pipeline run automatically feeds you deployment frequency, lead time, failure rates - all that good stuff. Jenkins, GitHub Actions, whatever you're using can push build success and test coverage without you lifting a finger. Honestly, trying to track this stuff manually would make me want to quit. Once you get the integration working, it's weirdly satisfying watching the metrics populate themselves. That's definitely your biggest bang for buck starting out.
So basically dashboards show you what's actually happening in your dev pipeline - stuff like cycle time, lead time, how much work is stuck where. Really helpful for catching bottlenecks early. Like if your code reviews are always taking 3+ days or testing keeps slowing everything down. I swear it's like having X-ray vision for your whole process! You can set up alerts when things go over your limits too. The real-time data catches patterns you'd totally miss when you're just focused on coding. Way better than guessing what's wrong.
Grafana's probably your best bet for visualizations, and Tableau if you need heavy analytics stuff. Honestly though? Just use whatever CI/CD tool you already have - Jenkins and GitLab both have decent dashboard features built in. Why reinvent the wheel, right? You can pull data from the usual suspects: Jira, GitHub APIs, SonarQube, monitoring tools like Datadog. Google Data Studio works too if you're feeling lazy (don't judge, we've all been there). Custom React dashboards are nice but only if you really need something specific. Start with what you've got first.
Honestly, just sit with your devs for like an hour and watch them work - you'll catch the pain points right away. Way better than guessing what they need. For feedback, ask specific stuff like "what do you check first?" instead of vague "do you like this?" questions. Heat maps show what people actually click vs what they totally ignore (which is kinda brutal but super helpful). User interviews work great too. I'd also set up regular feedback sessions - maybe monthly? That way you're building based on real usage instead of assumptions. Oh and surveys are fine but honestly watching someone struggle with your interface tells you everything.
Dude, get a dev dashboard set up ASAP. Sprint progress becomes crystal clear when everyone's looking at the same burndown charts and velocity data. Your standups will actually be useful for once - no more "wait, what's blocking story 247 again?" Plus you'll catch bottlenecks way earlier instead of scrambling at sprint end. I'd start with automated tracking for your current sprint first. Honestly, seeing where your team's time actually disappears to is pretty eye-opening. Way better than jumping between five different tools just to figure out if you're on track.
Honestly, cloud dashboards are pretty sweet - your whole team can pull up the same live data whether they're at home or in the office. No more of that annoying "well it looks different on my computer" stuff during meetings. Updates happen automatically so you don't have to deal with IT headaches. The best part? Everyone's looking at identical metrics during standups, which actually makes those meetings useful for once. They grow with your team too without buying more equipment. I'd just pick one and try it for a month - you'll probably get hooked pretty quick.
Look, dashboards are game-changers because they stop that annoying "wait, where are we at again?" back-and-forth. Your devs can track their bugs and code stuff. Meanwhile, execs see the big picture - timeline, budget, whatever keeps them happy. Same data, different views. I've seen teams waste so much time with random spreadsheets everywhere (nightmare fuel, honestly). The trick is figuring out what each group actually cares about first. Then you build their custom view so they're not swimming in irrelevant numbers. Trust me, a PM doesn't need to see every single code commit.
Start with auth stuff - only let the right people see sensitive data like salaries or security issues. Role-based permissions are your friend here. Encrypt anything sensitive and watch what you're logging. I've seen too many devs accidentally log API keys in plain text (whoops). Input validation is non-negotiable for preventing injection attacks. Security audits should happen regularly, and honestly? Keeping dependencies updated is probably the easiest thing you can do that'll prevent major headaches down the road. Those two alone will catch most issues.
Here's the thing - customizing dashboards by role is a game changer. Developers want build status and code coverage front and center. Meanwhile, project managers are obsessing over sprint progress and blockers. Totally different worlds, you know? QA engineers need their bug reports prioritized, not buried under deployment stats they'll never use. I'd set up role-based templates so everyone's critical info shows up first. Here's what works: ask each team what metrics they check when they grab their morning coffee. That's exactly what should dominate their dashboard view. Makes everything so much smoother.
AI insights are totally changing dev dashboards right now. Real-time collaboration and predictive stuff that catches bottlenecks early - way better than scrambling mid-sprint. Teams can finally customize views for metrics they actually care about instead of generic garbage. Integration across the whole DevOps stack is getting solid too. Basic ticket tracking feels ancient at this point, honestly. Modern platforms dig into your data and surface things you can act on, not just pretty charts. When you're shopping around, focus on prediction over reporting. That's where the real value is hiding.
So basically you can train ML models on your team's past data - stuff like code commits, test results, how fast you usually finish sprints. Then it'll predict deployment success rates, where bugs might pop up, that kind of thing. Honestly feels a bit like cheating sometimes. It can even warn you when someone's getting swamped or when tech debt's about to bite you. I'd probably start with just one thing you actually care about tracking though, don't try to predict everything at once. Way easier to get something working that way.
-
Thank you SlideTeam for such an excellent service.
-
The visual appeal of the templates is just unparalleled! I was so worried about the design of my presentation but SlideTeam made it all so easy.