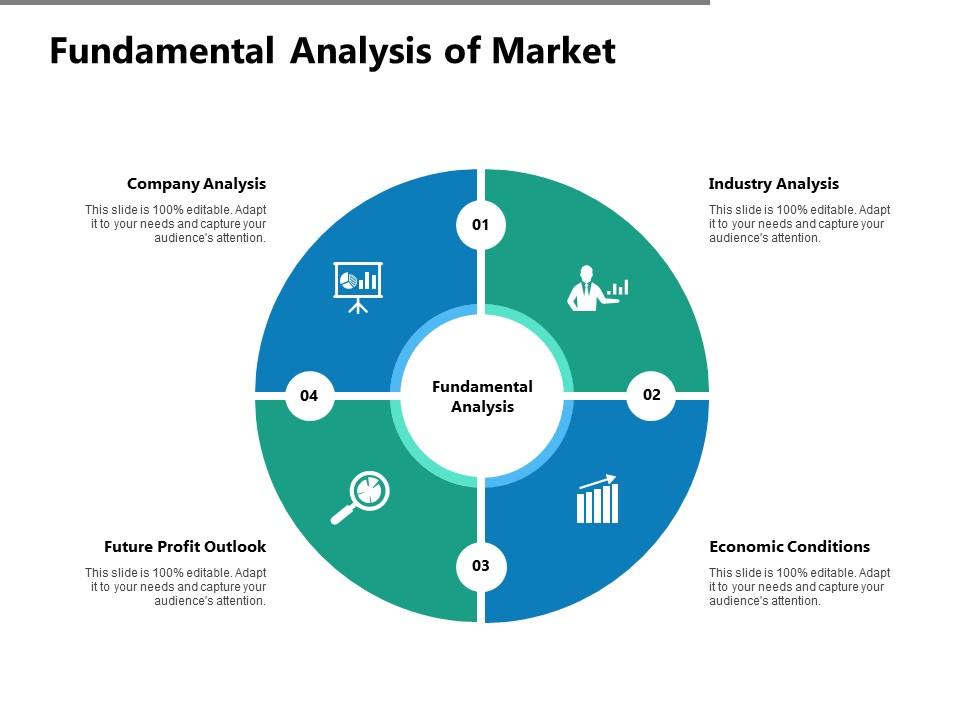
Fundamental analysis of market company analysis ppt powerpoint slides
Try Before you Buy Download Free Sample Product
Audience
Editable
of Time
The focus of our Fundamental Analysis Of Market Company Analysis Ppt Powerpoint Slides is always on achieving brilliance. Excellence is inherent in it.
People who downloaded this PowerPoint presentation also viewed the following :
Fundamental analysis of market company analysis ppt powerpoint slides with all 5 slides:
Discover the inherent brilliance of our Fundamental Analysis Of Market Company Analysis Ppt Powerpoint Slides. Increase the impact your ideas generate.
FAQs for Fundamental analysis of market company analysis
Okay so you want to look at three main statements. Income statement shows if they're actually making money - pretty straightforward. Balance sheet is like a snapshot of what they own vs what they owe at one point in time. But here's the thing - cash flow is probably the most important one and people sleep on it. A company can look profitable but be totally screwed for actual cash. I'd grab maybe 3-5 years of each and look for patterns instead of just one year's numbers. Makes way more sense that way.
So economic indicators are basically like taking the economy's pulse, and they mess with stock prices big time. Strong GDP or low unemployment? Companies will probably make more money, so stock values go up. Inflation data is what everyone obsesses over though - honestly it's kind of exhausting how much people freak out about every CPI report. When rates rise because of inflation fears, your future cash flows aren't worth as much today. DCF models reflect that. Before you invest, just pick 2-3 indicators that actually matter for whatever sector you're looking at.
Honestly, management assessment matters way more than people think. You're literally betting on these people to run your money well. Check their track record first - how long has the CEO been there, did they screw up at previous companies? Read their shareholder letters and earnings calls to see if they're straight shooters or full of BS. Some CEOs are total overpromisers. Also look at whether they actually own stock in their own company - if they don't have skin in the game, that's sketchy. Their strategic vision matters too, but actions speak louder than fancy PowerPoints.
So there's a few ways to tackle this. DCF models are probably your best bet - basically you're projecting future cash flows and discounting them back to today's value. P/E ratios work too if you compare them to industry averages for a quick gut check. Honestly though? It's half art, half science. There's just so many moving pieces. Book value and dividend models help round out the picture. I always use multiple methods since none of them are bulletproof on their own. Oh, and start with those free DCF calculators online - way easier than building your own spreadsheet from scratch. Once you get the hang of it, you can get fancier.
Focus on the three profit margins first - gross, operating, and net. They'll show you how well the company converts sales into actual money at each step. ROE is huge too since it reveals if management's doing anything useful with investor cash. Don't ignore ROA either, honestly. Track earnings per share growth over a few years - that's where you see if things are actually getting better or just staying flat. Compare everything to industry competitors and the company's own history. That's really the only way to tell if they're genuinely profitable or just coasting.
So quantitative stuff is basically all the hard numbers - revenue, profit margins, debt ratios, cash flow, anything you can pull straight from financial statements. Qualitative factors are the fuzzy things that matter but are way harder to measure. Think management quality, how strong their brand is, competitive position, regulatory stuff. Most people get tripped up on the qualitative side because it's so subjective (myself included tbh). I'd start with the numbers first to see if they're financially healthy, then dive into the qualitative stuff to figure out the actual story and what might happen next.
Honestly, industry trends can make or break any company's growth potential. Take traditional retail - even well-run stores are getting crushed by broader market shifts. Meanwhile, companies in hot sectors like renewable energy or cloud tech get this huge advantage just from being in the right space at the right time. It's kinda like that old saying about swimming with the current versus against it. You'll want to check out things like market expansion, tech changes, new regulations, consumer habits shifting. Oh and regulatory stuff too - that can really mess things up or create opportunities. Don't just look at how they're doing now, but whether they're set up for where their industry's heading.
So debt-to-equity ratio basically tells you if a company's drowning in debt compared to what shareholders actually own. Don't just look at the number though - you gotta compare it to similar companies. Like, tech startups usually keep things pretty lean, but utility companies? They're always gonna have higher ratios because building power grids costs a fortune. If the ratio keeps climbing year after year, that's sketchy. But honestly, sometimes it just means they're expanding fast. I'd check out the 3-5 year trend and see if their cash flow can actually handle the debt payments.
Honestly, cash flow is way more trustworthy than whatever profits a company claims. You can mess around with earnings using accounting tricks, but cash? Either it's there or it isn't. I've seen too many companies reporting solid profits while secretly bleeding money. That's a massive red flag. Look for businesses actually generating strong cash - those are the ones that can fund growth and pay dividends without stress. Free cash flow is your best friend here. It shows what's left after they cover operations and essential investments. Way more telling than any fancy earnings report.
So basically, ratio analysis helps you compare companies in the same industry on equal footing. Like, raw profit numbers don't tell you much - a $50M profit could be amazing or terrible depending on company size. But when you look at P/E ratios, debt-to-equity, profit margins, and ROE, you can actually see who's performing better. It normalizes everything so you spot which companies handle debt well and generate solid returns. Oh and make sure you're comparing similar business models though, otherwise it gets weird. Way more reliable than just staring at random financial numbers.
Look for companies with "moats" - stuff that makes them hard to copy. Apple's ecosystem keeps you locked in once you're using their products. Coca-Cola? Everyone knows that brand. Strong patents work too, or just being way cheaper than competitors. Honestly, the best test is asking yourself: what's stopping some startup from stealing their customers tomorrow? If you can't think of a solid reason, that's probably not a great long-term pick. Companies with real advantages can charge more and keep market share while others struggle to catch up.
Honestly, macro stuff can completely flip your fundamental analysis on its head. When interest rates jump, growth stocks get crushed because their future earnings look way less appealing. GDP data, inflation, employment numbers - they all mess with how people value stocks. Currency swings hit international companies hard too. I've seen solid companies with perfect fundamentals get destroyed just because the broader economy went south. It's wild how that works. So yeah, definitely check what's happening with the bigger economic picture first. You don't want to miss something that could change your whole investment thesis.
Past performance won't show you major disruptions coming - it's like driving backwards. Companies change direction, whole industries get flipped upside down, and those nice steady dividend payments? They can vanish overnight when you least expect it. I've watched so many "rock solid" stocks completely tank because everyone just looked at their track record. You gotta check what's actually happening now - where the industry's headed, what management's saying about the future. Don't get me wrong, historical data matters, but it's only part of the story.
Here's how I think about it - fundamentals help you pick *what* to buy, technicals tell you *when*. So I'll use fundamental analysis to screen for companies with solid financials and decent growth. But timing matters way more than people realize! Even amazing companies can be brutal entry points if you buy at the wrong time. That's why I check the charts and momentum indicators before jumping in. Fundamentals give me confidence I'm not buying garbage, while the technical stuff helps me actually make money on the timing. Works pretty well together honestly.
SEC filings are where you want to dive in first - 10-Ks, 10-Qs, and 8-Ks give you the real deal. If your company has Bloomberg Terminal access, you're golden. Otherwise Yahoo Finance works fine for most stuff. EDGAR is honestly pretty great for digging through filings (and it's free, which is nice). Morningstar's solid for comparing companies in the same industry. Oh, and definitely check the company's investor relations page - they usually post decent presentations there. I'd start with the annual report first, then work through everything else. Takes a bit of time but you'll get the hang of it.
No Reviews