

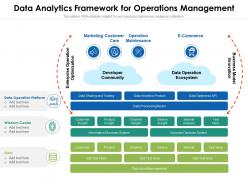
Data analytics framework for operations management





Try Before you Buy Download Free Sample Product
 Impress Your
Audience
 100%
Editable
 Save Hours
of Time


In order to make sound decisions, businesses need accurate and timely data. However, collecting and analyzing this data can be a complex process. In this blog post, we will introduce you to a data analytics framework that can help operations managers make better decisions. This framework can be used to collect, organize, and analyze data in order to improve business operations. The data analytics templates offered by SlideTeam are a valuable resource for getting insights into your business operations. These templates provide an easy-to-use framework for understanding and working with data, making it easier to identify problems and find solutions. With these helpful tools at your disposal, you can gain a deeper understanding of how your business is performing and take steps to improve its operations. So don't wait any longer - grab these amazing data analytics ppt templates now.
People who downloaded this PowerPoint presentation also viewed the following :
Data analytics framework for operations management with all 2 slides:
Use our Data Analytics Framework For Operations Management to effectively help you save your valuable time. They are readymade to fit into any presentation structure.

FAQs for Data analytics framework
You'll need the basics: data collection, cleaning tools, analysis software, and some kind of dashboard for visualization. Storage is huge - cloud or on-premises, whatever works for your budget. Governance policies sound boring but honestly they'll save you from compliance nightmares down the road. The human side matters just as much though - good analysts who can actually turn insights into decisions your team will act on. Oh, and build in feedback loops so you can keep tweaking things. I'd start by figuring out what data you already have, then work backwards from the business questions you're trying to solve.
Honestly, your data quality makes or breaks everything - you've probably heard "garbage in, garbage out" before but it's so true. Bad data will mess up even the fanciest analytics. I'd say spend way more time upfront figuring out exactly what you need and checking if it's actually good data. Timing's huge too - old data can totally mislead you when you're trying to make current decisions. Oh and consistency matters from day one. Trust me, I learned this the hard way on a project last year. Don't rush into the fun analytics stuff until your data foundation is solid.
So data preprocessing is basically cleaning up your raw data before you can actually analyze anything. You're gonna spend like 60-80% of your project time on this part - sounds crazy but trust me, messy data = useless results. It's kinda like washing vegetables before cooking, except way more tedious. You'll be fixing missing values, killing duplicates, getting formats consistent, maybe creating new variables. I learned this the hard way when I rushed through it once and my whole analysis was garbage. Always give yourself more time than you think you need for this step.
Tableau and Power BI are your best bets for serious analytical presentations - both crush it with interactive dashboards. If you're already coding your analysis, matplotlib/seaborn in Python works great (and it's free, which finance departments love). Excel's still surprisingly useful for quick visualizations though. Honestly, I'd say match the tool to who you're presenting to. Executives eat up those polished Tableau dashboards, but technical folks don't mind Python plots at all. Just start with whatever your company already has licenses for, then branch out.
Build security in from the start - don't try adding it later, trust me on that one. Set up role-based access so people only see what they need. Encrypt everything, both stored data and stuff moving around. Audit trails are non-negotiable for compliance. You'll also want data lineage tracking to know where everything came from and went. Classification policies help you handle sensitive data properly. The trick is making security part of your normal workflow instead of this separate thing everyone hates. Automated compliance checks catch problems early, which saves you so much headache down the road.
So ML basically plugs into your analytics setup in a bunch of ways. Predictive stuff for forecasting, automated pattern spotting in big datasets, real-time anomaly detection - the usual suspects. You can throw it at data preprocessing too (cleaning, feature engineering) which honestly saves you from wanting to tear your hair out. Classification and clustering will segment everything automatically. Oh, and recommendation engines are solid for personalizing insights by stakeholder. But seriously, don't go crazy at first. Just grab one thing you're doing manually over and over and test ML on that instead.
Honestly, your data's gonna be way messier than you expect - that's always the first surprise. Getting different systems to actually work together is a nightmare, and half your team won't understand why you're doing this in the first place. Tool selection becomes this whole rabbit hole where you either pick something too simple or way overcomplicated. Oh, and good luck finding people who can actually build AND maintain this stuff long-term. My advice? Pick one small project that'll show results fast. Once people see it working, they'll stop questioning everything you're trying to do.
Look, the language you pick really affects how fast you build stuff and whether your team can actually work together on it. Python's amazing for quick prototypes and has crazy good analytics libraries. R kills it for stats but gets sluggish in production. You'll definitely need SQL for data work, and if you're dealing with massive datasets, Scala or Java handle that better. I've literally watched teams burn months picking some trendy language nobody knew instead of sticking with what they're good at. Focus on your team's skills first, then think about data size and performance needs. Start with what you can actually execute well - the fancy new thing isn't worth it if you're stumbling around learning basics.
Validation is huge - check everything at input, during transforms, and at output. Set up monitoring to catch weird stuff early. I learned this the hard way when clean-looking data absolutely wrecked a project I was on! Keep audit trails so you can trace back through your pipeline when things go sideways. Document your data lineage clearly. Use checksums to spot unauthorized changes. Regular reconciliation between source and final data is clutch - you'll catch corruption before it becomes a nightmare. Oh, and hash functions are your friend for detecting tampering.
So here's the thing - your business goals are basically the foundation for everything else. Think about what you're actually trying to accomplish first. Want to keep customers around longer? Then you'll need user behavior tracking and churn prediction stuff. Focused on revenue growth instead? Sales funnel analytics and conversion metrics become your best friends. I always tell people to write down their top 3 business goals first, then figure out what data and dashboards will actually help with those. Otherwise you end up tracking random metrics that don't move the needle. The KPIs and data sources should flow naturally from there.
Pick 2-3 metrics that match your original goals first. Business impact stuff like ROI or cost savings - gotta show real value. User adoption is huge though, like who's actually opening your dashboards regularly? I've seen so many projects with great analysis that nobody uses. Data quality matters too because one bad dataset and people stop trusting everything. Oh, and if you can track how fast decisions get made now vs before, that's gold. Don't overthink it initially - you can always add more metrics later once you see what's working.
Honestly, Agile is a game-changer for analytics stuff. You can build in short sprints instead of planning forever upfront. Most stakeholders don't even know what they want until they see some initial results anyway - which is totally normal btw. Break your framework into smaller pieces you can actually test. Get feedback every couple weeks from real users. You'll spot problems way earlier and won't waste time building features nobody uses. The whole pivot-when-needed thing is clutch since requirements change constantly in analytics work.
Dude, the data analytics space is moving so fast right now. Real-time processing is huge - everyone wants streaming data handled instantly. Apache Kafka and Spark keep getting better at this stuff. Everything's going cloud-native too, with containerized and serverless setups everywhere. AI/ML integration is another massive trend. Automated feature engineering, model deployment - it's all becoming standard. Oh, and edge computing matters way more now because IoT data just won't stop growing. Honestly feels overwhelming sometimes! My advice? Pick frameworks that scale horizontally and play nice with cloud ML services. You'll thank me later.
Dude, stakeholder engagement literally makes or breaks everything. I've watched so many analytics teams waste months building fancy dashboards that collect dust because nobody asked what people actually needed. Super frustrating to see. You gotta get the right people involved from day one - they'll tell you what success looks like and help you focus on problems that matter. Map out your key stakeholders first, then set up regular coffee chats or whatever works. Without them, you're just guessing at what's important and trust me, you'll probably guess wrong.
Honestly, SQL and Excel are your bread and butter - can't get around those. Python or R will take you way further though for the heavy lifting analysis stuff. Stats knowledge is huge too, otherwise you're just making pretty charts that don't mean anything lol. But here's the thing nobody talks about enough - being able to explain your findings to non-technical people is make-or-break. Critical thinking and understanding the business side matter tons. I'd start with SQL first since everything builds on that foundation. Communication skills will honestly set you apart from other analysts who just live in spreadsheets all day.
-
Appreciate the research and its presentable format.
-
Qualitative and comprehensive slides.
-
Good research work and creative work done on every template.
-
Amazing product with appealing content and design.
-
Excellent work done on template design and graphics.
-
Content of slide is easy to understand and edit.