


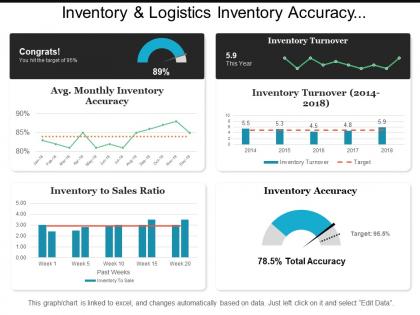
Inventory and logistics inventory accuracy dashboards




Try Before you Buy Download Free Sample Product
 Impress Your
 Audience
 100%
100% Editable
 Save Hours
 of Time


Our Inventory And Logistics Inventory Accuracy Dashboards act like glue. Their attention gets fixed on you.
People who downloaded this PowerPoint presentation also viewed the following :
Inventory and logistics inventory accuracy dashboards with all 6 slides:
Impress folks with your ability to discern facts with our Inventory And Logistics Inventory Accuracy Dashboards. It enables intelligent assessments.
FAQs for Inventory and logistics
So for the main ones, definitely track your cycle count accuracy percentage and inventory variance by location. Stock-out incidents too - that one's huge. Days of inventory on hand and shrinkage rates will show you what's actually going down in the warehouse. ABC analysis performance is clutch since it tells you if you're counting the right stuff first. Oh, and don't sleep on aging inventory and dead stock percentages. Honestly those basics will keep you busy for a while. You can always add breakdowns by product category later once everyone's used to checking the dashboard regularly.
Dude, real-time data is a game changer - you catch problems the second they happen instead of finding out weeks later when it's too late. Shrinkage, typos, system weirdness? You'll spot it instantly and actually fix stuff before it gets out of hand. I'll admit I got a little obsessed checking the live updates at first, but whatever. The real benefit is your accuracy data becomes useful for making daily calls instead of just looking backwards. Oh, and definitely set up threshold alerts so you're not glued to your screen all day. Trust me on that one.
Dude, you absolutely need tech for this stuff. Barcode scanners and RFID tags do all the heavy lifting - no more counting by hand like it's 1995. Real-time dashboards show you exactly what's happening with your stock levels, and honestly? The pattern recognition alone will save your butt when things start going sideways. IoT sensors are pretty sweet too since they monitor everything automatically. Just make sure whatever you pick actually plays nice with your current systems. Trust me, doing inventory manually these days is brutal - like trying to text on a flip phone.
So I'd go with variance charts and heat maps - they're honestly game-changers for spotting issues fast. Set up bar charts showing recorded vs actual quantities side by side. Then add a variance column that flags anything over your threshold (like 5-10%). Heat maps are perfect because they color-code problem spots by location or product type. Also throw in a trend line for discrepancy rates over time - you'll see if you're improving or things are going downhill. Oh, and definitely start with high-value items since those screw-ups cost the most. Makes the biggest impact right away.
Dude, start with your big metrics right at the top - accuracy rates, cycle count issues, alerts for weird stuff. Color coding should be obvious (red = bad, green = good) but don't go crazy with it. Seriously, I've seen dashboards that look like a Vegas casino with all the flashing colors. Keep filters super simple so people can dig down from the overview to specific products or areas. Oh, and test it with the warehouse crew first - they'll spot problems you totally missed. Don't cram everything onto one screen or nobody will actually use the thing.
So basically, pull your last 12 months of sales data and look for patterns that repeat. You'll spot seasonal spikes, which products always tank, when you typically run out of stuff. Year-over-year comparisons are honestly my favorite - they show you everything. Like, maybe winter boots always sell poorly in March (duh) but you keep ordering them anyway? This stuff helps you fix reorder points before you're stuck with dead inventory. Oh, and you can actually plan ahead for busy seasons instead of scrambling. Just scan for anything that happens at the same time each year.
Honestly, I'd go with Power BI first - it's pretty solid and won't break the bank. Tableau and Looker are great too but pricier. Excel works if you're strapped for cash (I've seen some impressive spreadsheets), though it gets messy with tons of data. Check if your current system like NetSuite already does reporting - might save you time since everything's connected. Qlik Sense is decent for the fancy analytics stuff. But yeah, Power BI plays well with most systems and the learning curve isn't terrible. Start there and see how it goes.
So these dashboards show you what's actually sitting in your warehouse vs what your computer system says you have. Game changer for making quick decisions. You can spot problems fast and tweak your ordering without waiting around for someone to physically count everything. Better data means way fewer "oh crap we're out of stock" moments - or the opposite where you're drowning in inventory you can't move. Honestly, focus on your biggest headaches first. That's where you'll see results fastest. It's basically like having superpowers for your supply chain, no joke.
Honestly, your data's gonna be a hot mess - different formats, missing stuff, systems that hate each other. That's always the worst part. Getting your team on board is rough too. Warehouse guys don't want new scanning procedures, and managers obsess over weird metrics that don't actually help. Oh, and you'll drown trying to figure out which KPIs actually matter vs. just creating dashboard chaos. My advice? Pick one location or product line first. Way easier to fix problems when you're not dealing with everything at once.
Look, dashboards are basically your warehouse crystal ball. They show you historical trends and seasonal patterns next to your current stock levels. You'll spot which items are flying off the shelves and which ones are just collecting dust. Set up automated alerts when stuff hits reorder points - trust me, this saves so much headache. Most dashboards will suggest how much to order based on your sales data too. Oh, and start with your top 20% of products first. Don't try to track everything at once or you'll get overwhelmed. Once you're comfortable, expand from there.
Honestly, you really need to connect that dashboard to your ERP - trust me on this one. Real-time data is everything because otherwise you're stuck with crappy spreadsheets that are always wrong. When it's all synced up, your accuracy numbers actually mean something and reflect what's really happening. You'll catch problems way faster and stop making those terrible purchasing calls. Plus no more explaining to pissed off customers why their stuff isn't available. I'd start by figuring out what data needs to move between the systems first - that's usually the tricky part anyway.
Honestly, dashboards are a game-changer for getting your inventory and finance people on the same page. Both teams see the same real-time numbers - stock levels, what stuff's actually worth, where things don't add up. No more waiting three days for outdated spreadsheets (seriously, why is this still a thing?). You'll catch inventory shrinkage eating into margins way faster. Cash flow issues from bad purchase timing become obvious too. The visual setup makes those budget conversations so much smoother than endless email chains with different numbers. Try doing weekly reviews together - keeps everyone talking instead of guessing.
Color coding is seriously a lifesaver - you get instant visual feedback with red for problems, yellow for watch-out zones, green for hitting targets. Instead of digging through boring spreadsheets, you can spot issues across hundreds of products in seconds. Your team knows exactly which items need attention first and which locations keep screwing up. Monthly reviews actually become interesting when people can see the patterns instead of just staring at numbers. Oh, and make sure everyone agrees on what each color means upfront so there's no confusion later.
Set up automated validation rules first - trust me, I had negative inventory showing for weeks because I skipped this step. Real-time syncing between your WMS and ERP is clutch, but if that's not possible, sync as often as you can. Alerts for weird variances will save your butt when physical counts don't match the system. Train everyone to speak up about data weirdness right away instead of sitting on it until month-end (honestly, this part's harder than the tech stuff). Start by figuring out where your data gaps usually happen - that'll tell you exactly what to fix.
Definitely go with role-based filtering and customizable widgets - that's your foundation. Operations people live for real-time stock levels and variance alerts, but execs just want the high-level KPIs and trend stuff. Finance is obsessed with cost impact views and aging inventory (shocking, I know). You'll need adjustable date ranges, drill-downs for specific SKUs or locations, plus personalized alert thresholds since everyone freaks out at different inventory levels. Don't forget export features - people are weirdly attached to their spreadsheets. Honestly, just figure out what each team actually does with inventory data every day, then work backwards from there.
No Reviews