

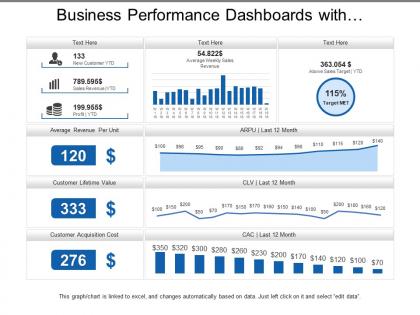
Business performance dashboards with average revenue and customer lifetime value





Try Before you Buy Download Free Sample Product
 Impress Your
 Audience
 100%
100% Editable
 Save Hours
 of Time


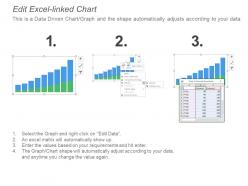
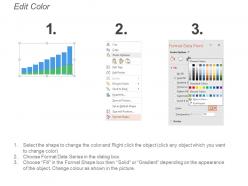
If your administration needs to be at its best, then try our business performance dashboards with average revenue and customer lifetime value PPT template. The concept of business performance indication through average revenue and customer lifetime is shown here. This PPT diagram contains the graphic of bar graphs and bar graphs to indicate your figures and data. Professionals can use this slide for explaining the strategic finance presentations and business performance indicators. It is a clever and professional PPT design, which adds to the decision and policy-making as it systematically processes the pro's and con's along with performance and business functionality so as to not miss any qualitative factors of any scheme in progress. Enable folks to generate higher incomes with our Business Performance Dashboards With Average Revenue And Customer Lifetime Value. Highlight good investments.
People who downloaded this PowerPoint presentation also viewed the following :
Business performance dashboards with average revenue and customer lifetime value with all 6 slides:
Forces act in cohesion with our Business Performance Dashboards With Average Revenue And Customer Lifetime Value. Harness all the available energy.
FAQs for Business performance dashboards with average revenue and
Honestly, start with cash runway - that's your lifeline right there. Track MRR if you're doing SaaS, regular monthly sales otherwise. CAC vs LTV matters but early LTV numbers are basically wild guesses anyway. Skip the vanity stuff like web traffic for now. What you really need to watch: burn rate, revenue growth, and churn. Just build a simple dashboard with these basics first. You can always get fancy later once you've got some real data coming in. I've seen too many founders obsess over 20 different metrics when they should be laser-focused on whether they're making money or running out of it.
Yeah, KPIs are totally different across industries because what matters for success varies so much. Like, if you're running retail, you're tracking inventory turnover and same-store sales. But SaaS companies? They're laser-focused on monthly recurring revenue and churn rates instead. Manufacturing is obsessed with efficiency and defect rates - makes sense when you think about it. Generic stuff like "revenue growth" is fine but honestly kind of surface-level. The real magic happens when you figure out what actually drives performance in your specific space, then build your whole dashboard around those metrics.
Think of financial metrics as your business health checkup - they'll tell you if you're actually building something that'll last or just burning cash. Cash flow trends are huge. Same with debt-to-equity ratios and profit margins. ROI and customer acquisition costs can literally make or break you (I've seen too many startups ignore these). Don't just treat them like report cards though. They're telling a story about where you're headed. Set up monthly reviews so you catch problems early. Way easier to fix a small leak than replace the whole roof, you know?
Dude, those non-financial metrics are actually huge for your bottom line. Happy customers stick around longer and bring their friends - it's basic word of mouth. Your employees matter too because turnover is expensive as hell (like, way more than you'd think). I read somewhere that just a 5% boost in keeping customers can bump profits by 25-95%. Crazy right? Start doing quick customer surveys and check in with your team regularly. These things predict where your money's going before it actually shows up in the numbers. Both are worth tracking.
Ugh, data silos are the worst - everyone's hoarding their info like it's treasure. Your marketing team will swear a "qualified lead" means one thing while sales insists it's something totally different. Been in those painful alignment meetings way too many times! Get everyone on the same page about definitions first. Create one source of truth for each metric instead of having five different spreadsheets floating around. Focus on stuff that predicts what'll happen, not just what already did. And honestly? Most teams obsess over metrics that look impressive in reports but won't actually help you make better decisions. Clean house regularly - what mattered six months ago might be useless now.
Monthly reviews are your baseline - catch problems before they spiral. Then do quarterly deep dives to see if you're actually tracking stuff that matters. Honestly, I've watched so many teams get stuck in endless weekly panic meetings and completely miss the forest for the trees. Tech and retail might need more frequent check-ins though, depends on how fast things change in your space. Oh, and actually put these in your calendar right now or you'll just keep saying "next month" forever. Trust me on that one.
Honestly? Most people get obsessed with vanity metrics - like follower counts and page views that look cool but don't actually help you make real decisions. Teams also love cherry-picking dates to make their numbers look better, which is just self-deception at its finest. Don't analyze stuff in isolation either. Your metrics need to connect to actual business goals, not just exist as random data points. And here's the thing - you can get so wrapped up measuring everything that you never actually DO anything with the insights. Been there! Just pick 3-5 metrics that genuinely impact your bottom line and check them regularly.
Honestly, charts and graphs are lifesavers when you're trying to explain data to people. Nobody wants to dig through endless spreadsheets - I've watched executives' eyes glaze over trying that approach. Visual stuff like dashboards lets everyone quickly see if things are trending up or down. Way better than making people hunt through rows of numbers for 20 minutes. Different chart types work better for different stories too. Start with figuring out what metrics actually matter, then pick whatever visual format tells that story clearest. Your stakeholders will thank you.
So if you're still in growth mode, watch your revenue growth rate and customer acquisition costs - that's what matters. Also track how fast you're grabbing market share and yeah, keep an eye on cash burn (obviously). Once you hit maturity though, flip the script. Profit margins become king. Customer lifetime value, operational efficiency, return on capital - that's your new bible. Here's how I think about it: early on you're asking "are we growing fast enough to dominate?" Later it's "how much money can we actually squeeze from this thing?" Track everything but weight your decisions based on which phase you're really in.
Oh yeah, this is huge in global companies. Teams in different regions literally see the same numbers and walk away with totally different takeaways. Like, American teams obsess over individual performance metrics while Asian teams care way more about group results. Then there's the whole time thing - some cultures want quarterly wins, others think in years. Risk tolerance is all over the place too. Even how you format a dashboard can confuse people (learned that the hard way once). Best thing you can do? Get everyone on the same page about what metrics actually mean before sharing anything across regions.
Honestly, the biggest game-changer is getting rid of all that manual copying and pasting you're probably doing. Set up dashboards that pull straight from your CRM and accounting stuff - way better than living in Excel like some kind of spreadsheet hermit. Real-time reporting catches trends right away instead of waiting around for monthly summaries. Oh, and automated alerts are clutch - they'll ping you when numbers hit whatever thresholds you set. I'd start by figuring out which tracking tasks eat up most of your time, then find tools that actually play nice with what you're already using.
Honestly, the trick is making metrics feel like they actually matter to people. Pick 2-3 numbers that really move the needle - don't go overboard tracking everything because that's just noise. Connect what each person does to the bigger wins so they can see their impact. Dashboards are clutch for keeping progress visible. When someone hits their targets, celebrate it! Too many managers only speak up when things go wrong. I'd start simple - one solid metric per person that ties directly to business results, then expand from there once you've got momentum.
Yeah, so market trends basically force you to rethink what you're even tracking. Customer behavior changes fast - like everyone going mobile-first means your desktop conversion rates are kinda pointless now. I'd say audit your metrics every quarter against what's actually happening in the market. Drop the KPIs that aren't telling you anything useful anymore. Pick up new ones that capture where things are headed. Honestly, most companies get way too attached to their old dashboards. You gotta stay flexible or you'll be measuring yesterday's game while everyone else moved on.
Figure out what metrics actually move the needle in your space first - stuff like revenue per employee or customer acquisition costs. Industry reports from McKinsey or Deloitte are solid, but honestly? Trade association data works just as well and won't cost you an arm and a leg. PitchBook's great if you've got access. Check your numbers quarterly instead of waiting a whole year - trends tell the real story. Don't go crazy trying to benchmark everything though. Pick 3-5 metrics that matter most. Maybe start with analyzing one competitor this month and expand from there.
For predicting performance from historical data, you've got a few solid options. Time series analysis is perfect for catching trends and seasonal stuff in your metrics. Regression shows you what factors actually move the needle on performance. Random forests and other ML models can tackle complex relationships, but honestly they're way overkill unless you're dealing with massive datasets. Moving averages sound boring but they work surprisingly well for short-term predictions. Match your approach to how clean your data is and your timeline. Oh, and definitely start with basic trend analysis before getting fancy - I learned that the hard way.
No Reviews