


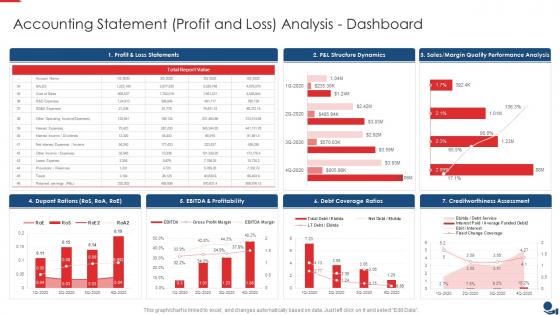
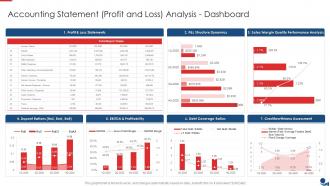
Finance And Accounting Accounting Statement Profit And Loss Analysis Dashboard




Try Before you Buy Download Free Sample Product
 Impress Your
 Audience
 100%
100% Editable
 Save Hours
 of Time


This graph or chart is linked to excel, and changes automatically based on data. Just left click on it and select Edit Data.
People who downloaded this PowerPoint presentation also viewed the following :
Finance And Accounting Accounting Statement Profit And Loss Analysis Dashboard with all 7 slides:
Use our Finance And Accounting Accounting Statement Profit And Loss Analysis Dashboard to effectively help you save your valuable time. They are readymade to fit into any presentation structure.





FAQs for Finance And Accounting Accounting Statement Profit And
A profit and loss statement includes revenue, cost of goods sold, gross profit, operating expenses, operating income, and net profit. These components enable businesses to assess operational efficiency, identify cost reduction opportunities, and make strategic decisions, with many organizations finding that regular P&L analysis streamlines financial planning and enhances competitive positioning.
Profit and loss analysis helps financial decision-making by identifying revenue trends, cost patterns, profit margins, and operational inefficiencies across different business segments. Through detailed P&L evaluation, organizations streamline resource allocation, optimize pricing strategies, and prioritize high-performing divisions, with many companies finding that regular analysis enables faster strategic pivots and ultimately delivers improved profitability and competitive positioning.
Revenue recognition determines when and how income is recorded in P&L statements, directly impacting reported profitability, cash flow timing, and financial performance metrics. This accounting principle ensures accurate period matching between revenues and expenses, with many organizations finding that proper recognition practices enhance investor confidence, regulatory compliance, and strategic decision-making capabilities.
Variable costs fluctuate with production volume while fixed costs remain constant, creating different profitability impacts at various business scales. Higher variable costs reduce per-unit margins but offer flexibility during downturns, while excessive fixed costs can strain cash flow but deliver greater profitability at scale, with many manufacturing and retail companies finding that optimizing this balance significantly enhances operational efficiency.
Common pitfalls include ignoring seasonal trends, focusing solely on top-line revenue without examining cost structures, misclassifying one-time expenses as recurring costs, and failing to compare performance against industry benchmarks. These interpretation errors can mislead strategic decisions, with many organizations finding that comprehensive analysis across multiple periods, coupled with contextual market data, delivers more accurate insights and stronger competitive positioning.
Businesses use P&L statements for budgeting and forecasting by analyzing historical revenue patterns, expense trends, and profit margins to project future financial performance. These statements enable organizations to identify seasonal variations, cost fluctuations, and growth opportunities, with many companies finding that detailed P&L analysis streamlines resource allocation, enhances strategic planning, and ultimately delivers more accurate budget predictions and competitive advantage.
Key metrics include cash flow statements, balance sheet ratios, debt-to-equity ratios, current ratios, and return on investment figures. These financial indicators work alongside profit and loss data by revealing liquidity positions, operational efficiency, and long-term sustainability, with many organizations finding that comprehensive analysis delivers better strategic decisions and competitive positioning.
Seasonal trends significantly impact profit and loss results through fluctuating revenue patterns, variable operating costs, and shifting customer demand cycles throughout the year. Retail businesses experience peak holiday sales while hospitality sees summer surges, requiring strategic inventory management, staffing adjustments, and cash flow planning to optimize profitability during both high and low seasons.
Gross profit represents revenue minus direct production costs, while net profit is what remains after deducting all expenses including operating costs, taxes, and interest. This distinction is significant because gross profit reveals product profitability and pricing effectiveness, while net profit shows overall business health, with many organizations finding that analyzing both metrics enables better resource allocation and strategic decision-making.
Market conditions significantly influence profit margins through supply and demand dynamics, raw material costs, consumer spending patterns, regulatory changes, and competitive pressures across industries. Economic downturns typically compress margins in retail and hospitality, while healthcare and utilities maintain stability, with technology companies often demonstrating resilience through innovation and scalability, ultimately enabling strategic businesses to adapt pricing models and optimize operations for sustained profitability.
Businesses can improve P&L outcomes through revenue diversification, cost optimization, operational efficiency improvements, strategic pricing adjustments, and technology automation. These strategies work by expanding market reach, reducing unnecessary expenses, and streamlining processes, with many organizations finding that combining revenue growth initiatives with disciplined cost management ultimately delivers sustainable profitability and competitive advantage.
Technology and software tools enhance profit and loss analysis by automating data collection, providing real-time financial insights, and enabling advanced forecasting capabilities. Through cloud-based platforms and AI-driven analytics, organizations streamline reporting processes, identify cost reduction opportunities, and accelerate decision-making, with many financial departments finding that automated systems deliver significantly improved accuracy and strategic visibility.
Startups should focus on burn rate, runway analysis, and milestone-based financial tracking, while established companies emphasize variance analysis, departmental profitability, and trend comparisons against historical data. Through tailored approaches, startups can monitor cash flow sustainability and growth metrics, while established organizations streamline operational efficiency and strategic resource allocation, ultimately delivering relevant insights for their respective business stages.
Tax considerations significantly impact profit and loss evaluations by affecting net income calculations, cash flow projections, and strategic decision-making processes. Through careful tax planning and analysis, organizations can optimize deductions, minimize liabilities, and enhance overall profitability, with many businesses finding that proactive tax strategies ultimately deliver improved financial performance and competitive advantage.
Comparative analysis reveals performance trends by examining revenue growth, expense patterns, profit margins, and cost fluctuations across quarters or years. This approach enables businesses to identify seasonal variations, track strategic initiatives' impact, and benchmark against industry standards, while highlighting operational inefficiencies and growth opportunities, ultimately delivering data-driven insights for strategic planning and improved financial decision-making.
-
The design is very attractive, informative, and eye-catching, with bold colors that stand out against all the basic presentation templates.
-
Keep doing the good work guys. Surpass the needs and expectations always!!