


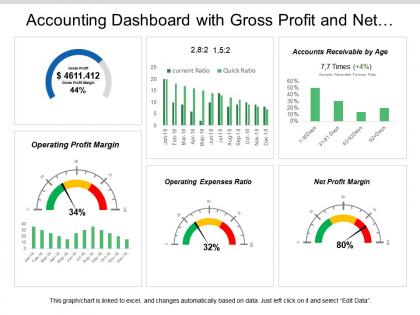
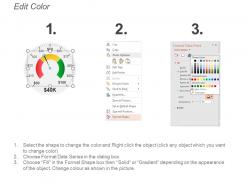
Accounting dashboard with gross profit and net profit margin




Try Before you Buy Download Free Sample Product
 Impress Your
 Audience
 100%
100% Editable
 Save Hours
 of Time


Planning to create an innovative presentation design for your next business presentation. If yes then check our accounting dashboard with gross profit and net profit margin PPT template. This wonderful accounting dashboard with gross profit and net profit margin PowerPoint slide show comes with editable charts and graphs which reflect percentages consumed over a period of time. To show the business data, you need to ensure that you are showing it in the best possible way. Giving importance to each and every number which you show in the slide is crucial as your team needs to understand the significance of numbers. This accounting dashboard Presentation visual is designed by keeping in mind the need for every organization. Moreover, this KPI dashboard PPT slide has time-saving capabilities and is extremely spacious to include vast content under single screen view. Just download the presentation graphic and then share it with who so ever you are looking to share with. Folks ask to be included due to our Accounting Dashboard With Gross Profit And Net Profit Margin. They feel eager to join the campaign.
People who downloaded this PowerPoint presentation also viewed the following :
Accounting dashboard with gross profit and net profit margin with all 6 slides:
Our Accounting Dashboard With Gross Profit And Net Profit Margin are classic yet contemporary. A beautiful blend of the best of all ages.


FAQs for Accounting dashboard with gross profit and
Start with cash flow and AR aging - those are your bread and butter for knowing if you're actually making money. Gross margin and operating margin come next because honestly, your boss will ask about those in every meeting. Current ratio and days sales outstanding are solid for tracking financial health too. I'd throw in budget vs actual variance because that one's a lifesaver when things go sideways. Revenue trends are obvious but necessary. Maybe add some forward-looking stuff if your system can handle it, but don't go crazy - like 6-8 metrics tops or you'll just overwhelm everyone.
Honestly, it's a game changer for staying on top of your finances. You get live updates on cash flow and P&L instead of waiting around for those dreaded month-end reports. No more drowning in spreadsheets either - everything's right there in one spot. When something looks weird, you can dig deeper immediately. Like if your cash is getting tight or clients aren't paying up, you'll catch it fast. Makes decision-making so much easier when you're not flying blind. I probably check mine way too often now, but it beats the alternative of finding out about problems after it's too late.
Honestly? Just go with Power BI, Tableau, or Google Data Studio if money's tight. They all handle financial stuff well and connect to QuickBooks, SAP, whatever you're using. I'm probably biased but Power BI is solid since it works with Excel - and we both know you're still living in spreadsheets half the time lol. Tableau's got more bells and whistles but takes forever to learn. Start simple: revenue, expenses, cash flow cards. Then add some trend charts and budget comparisons. Pick whatever your team won't abandon in six months.
Dude, you really need real-time updates for your accounting dashboard. Making decisions with stale data is like driving with a foggy windshield - you'll miss cash flow issues or good opportunities. I've watched teams spend forever fixing problems that live dashboards would've caught right away. Hourly updates work great for most stuff, though smaller companies can probably get away with daily. Oh, and set up alerts for important numbers so you're not glued to the screen all day. Trust me on this one.
Honestly, the worst thing you can do is jam everything onto one screen. Users get totally lost and don't know where to start looking. Keep it to like 5-7 key metrics at first - you can always add more later based on what people actually want to see. Skip the vanity metrics too. I swear, half the dashboards I've seen are just there to look pretty but tell you absolutely nothing useful for making decisions. Also make sure your data updates often enough to matter, keep everything formatted the same way, and definitely test it with real users first. That last part will save you so much headache.
Honestly, just focus on what actually moves the needle in your industry. Retail? You want inventory turnover and gross margins right there. SaaS companies obsess over MRR and churn - that's your bread and butter. Most tools are pretty drag-and-drop these days, which is nice. Think about the top 5 numbers everyone in your space talks about constantly, then build your dashboard around those. I'd start by stalking what your competitors track (sounds creepy but whatever). Once you know what matters, configuring the widgets is straightforward.
So data integration is basically what connects all your financial stuff together - QuickBooks, bank accounts, payroll, whatever. Without it you're manually copying numbers between systems which honestly sounds awful. Real-time syncing means your cash flow and expense data stays updated automatically. I learned this the hard way when I spent way too many hours updating spreadsheets instead of actually looking at the numbers. Just make sure your dashboard can talk to all your main financial systems. Otherwise you'll waste time on data entry instead of figuring out what's happening with your business.
So basically, an accounting dashboard pulls all your financial stuff into one place and tracks compliance metrics automatically. You'll get alerts before deadlines hit, which is honestly a lifesaver. It monitors your ratios and spits out those standardized reports auditors love - no more digging through random spreadsheets when they show up. Everything syncs from your different systems, so you're always ready with clean, consistent data. Month-end becomes way less stressful. I'd start with your biggest compliance headaches first and build dashboards around those.
Set up automated validation rules first - catches duplicates and weird amounts before they mess up your dashboard. Daily or weekly reconciliation is clutch, just compare your dashboard numbers against actual accounting records. Honestly, this saved my butt when we caught a $50K error that had been sitting there for weeks. Pull everything from one source if possible, multiple systems never sync right and it's a nightmare. Oh, and set alerts for big variances so you can jump on issues fast. Trust me on this one.
Your dashboard needs to actually make sense for how people work - map out what your team does daily first. Most accounting dashboards are honestly terrible because they dump everything on you at once like some nightmare spreadsheet. Instead, organize stuff logically with clear visual flow and consistent navigation. Break data into chunks people can actually digest. Smart filtering helps a ton, and put the important metrics right up front where you can't miss them. Oh, and use icons people recognize - don't make them guess what things do. When it's designed around real workflows instead of just cramming features in, people will actually want to use it.
Dude, mobile access is a game changer for accounting dashboards. You can check your numbers anywhere instead of being stuck at your desk when something urgent comes up. Like when cash flow alerts hit or you're in a meeting and need to pull up budget variances on the spot. Real-time notifications help you catch issues way faster too. I honestly don't know how I survived with just desktop access before - seems so limiting now. Just double-check that your dashboard actually functions well on mobile first, because some are pretty clunky on phones.
Connect your dashboard to ML models that crunch your historical financial data - they'll spot patterns and forecast stuff like cash flow and revenue. Power BI and Tableau have made this surprisingly simple now (thank god, because it used to be a nightmare). Set up automated feeds from your accounting system first. Then let algorithms do their thing to predict future scenarios. Honestly, I'd start with just monthly revenue forecasting. Test how accurate it is against real results before expanding to other metrics. Once you prove it works, you can build from there.
Honestly, just put your most critical stuff right up top - cash flow, P&L, budget vs actual. Charts beat tables every time for showing trends (seriously, who wants to stare at rows of numbers?). But keep some detailed tables further down for when people need to dig deeper. What's worked really well for me is having different sections for different people. Executives get the high-level view, department heads can focus on their specific costs. Start simple though - maybe a three-panel layout first. You can always add more complexity once everyone gets used to it. Clean visual sections make all the difference.
So basically, your platform controls what data you can see and how you see it. QuickBooks has decent dashboards but you can't customize much. Xero's better for integrations if you need that. NetSuite and Sage let you build whatever - though honestly, that's way overkill for most people and just confuses things. Start with what you actually check every day. Cash flow? P&L? Write that down first. Then pick whatever makes those numbers easiest to find. Don't get fancy if you don't need to - I've seen too many people get lost in dashboards they never use.
Honestly, you gotta stack multiple security layers for this stuff. Role-based access is huge - only let people see what they actually need. Multi-factor authentication is annoying but worth it. Encrypt everything, both when it's moving around and sitting in storage. That's like security 101 for financial data, no excuses there. Set up audit trails so you know who's poking around where. HTTPS for all connections, obviously. Session timeouts are smart too - I learned that one the hard way at my last job. Regular access reviews help catch people who shouldn't have permissions anymore. The whole point is redundancy, so if something breaks you're not totally screwed.
No Reviews