

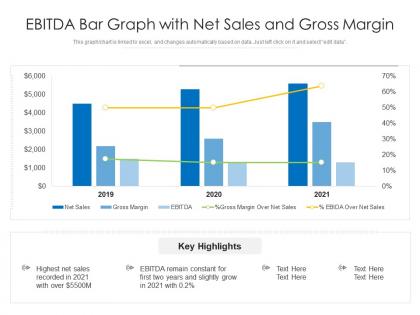
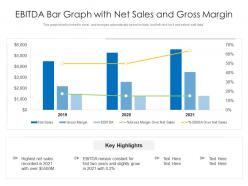
Ebitda bar graph with net sales and gross margin




Try Before you Buy Download Free Sample Product
 Impress Your
 Audience
 100%
100% Editable
 Save Hours
 of Time


This graph or chart is linked to excel, and changes automatically based on data. Just left click on it and select edit data.
People who downloaded this PowerPoint presentation also viewed the following :
Ebitda bar graph with net sales and gross margin with all 2 slides:
Use our EBITDA Bar Graph With Net Sales And Gross Margin to effectively help you save your valuable time. They are readymade to fit into any presentation structure.
FAQs for Ebitda bar graph with net sales
Hey! So for your performance report, definitely hit the big ones - revenue growth, gross margin, net profit margin. Cash flow from operations is huge though, can't stress that enough. I've literally watched companies tank because they looked great on paper but had zero actual cash coming in. ROE and debt-to-equity ratio show if they're financially solid. Current ratio too. Oh and operational stuff like inventory turnover, accounts receivable days. Honestly just pick like 6-8 that your audience actually cares about - nobody wants to wade through 20 different metrics.
Okay so cash flow statements are basically tracking actual money going in and out of a business. Super important because - and this might surprise you - profit doesn't always mean cash sitting in the bank. You can see if they're actually making money from their core business, how much they're spending on growth, debt stuff, dividends, whatever. I honestly think it's way more useful than other financial statements since companies can't really fake the cash numbers. Like, a profitable company can literally go bankrupt if they can't pay their bills! Just focus on operating cash flow first - if that's positive and growing, you're probably good.
Look, forecasting is basically your money roadmap for making smart moves. Before launching that new product or hiring spree, you need to know if you can actually afford it. Think road trip planning - except you're checking your gas money first (trust me on this one). Strategic decisions without forecasts? You're flying blind. Build forecasts that connect to real goals, not just what you hope will happen. Short sentences work. Longer ones help you see the bigger picture of where your cash flow's heading. Don't just guess - your future self will thank you.
So variance analysis is basically your financial detective work - it tells you WHY your numbers look the way they do. Like if sales dropped 5%, you'll know if it was because fewer people bought stuff, pricing got weird, or your product mix shifted. Super helpful for figuring out what's actually broken vs what's crushing it. Then you can fix the real problems instead of just guessing. My old boss used to say it's like having X-ray vision for your budget, which sounds cheesy but honestly? Pretty accurate. You can pivot mid-year instead of waiting around wondering what happened.
So liquidity ratios show whether you can actually pay your bills without panicking. Too high? You're sitting on cash instead of growing the business. Too low and you'll be scrambling when payments are due - investors hate that uncertainty. Honestly, I've seen companies get burned both ways. The magic number depends on your industry, but you want enough cushion to handle surprises without becoming a cash hoarder. Quick ratio's usually more telling than current ratio since it strips out inventory. Check these monthly if you can - quarterly at minimum. Better to catch problems early than explain them to your bank later.
Ugh, recessions are brutal for business numbers. Revenue drops because everyone's tightening their belts, but your fixed costs? Still there - rent, payroll, loan payments keep coming. Margins get crushed from both directions. Cash flow becomes this rollercoaster you don't want to be on. If your company's value drops, debt ratios look even worse on paper. Supply chains get wonky too, which honestly just adds insult to injury. The companies that actually monitor this stuff closely can adapt faster though. Most businesses are just guessing their way through it.
Dude, you gotta compare your numbers to what everyone else is doing. Like, that 15% profit margin might feel good until you find out your competitors are pulling 25%. Honestly, I learned this the hard way - thought my business was killing it when we were actually pretty mediocre. Industry benchmarks help you catch trends early and figure out exactly what needs fixing. Investors will definitely ask how you stack up too. Check your trade association's reports or hit up some financial databases to see the real deal. Don't fly blind on this stuff.
Look, one year of financials tells you basically nothing - it's like judging someone's driving skills from a single trip. When you check out 3-5 years of data though, the real patterns jump out at you. Revenue growing consistently? Profit margins holding steady? Debt getting sketchy? You'll actually see it. Plus you can tell if their good numbers are legit or just some fluke year (happens more than you'd think). Short bursts of success don't mean much. The trend shows you where they're really headed financially.
Honestly, just focus on telling the actual story first. Line charts work great for showing trends, bar charts for comparing stuff - but seriously avoid pie charts, they're garbage for financial data. Make sure your colors stay the same across reports or you'll confuse everyone. Context is huge too - always throw in prior periods or benchmarks because nobody cares about random numbers floating in space. Oh, and label everything clearly so people aren't squinting trying to figure out what they're looking at. Lead with what it all means before diving into the charts.
Honestly, your financial numbers are what make or break investor confidence. Good results? People trust you and money flows in. Bad quarters make everyone jumpy and your stock takes a hit. Growth and consistent profits - that's what they're hunting for. When you mess up, expect brutal earnings calls and analysts trashing your rating. Sometimes activist investors start circling like vultures, which is never fun. But here's the thing - even during rough patches, being upfront about your plan to fix things keeps investors from completely losing faith. Transparency beats spin every time.
Honestly, those non-financial metrics are way more telling than people realize. Customer satisfaction, employee turnover, market share shifts - they're like canaries in the coal mine. Your revenue might look fine today, but if customer retention is tanking? That'll bite you in a few months. Same with high turnover rates - productivity goes down, costs go up, it's inevitable. I've seen it happen so many times. The trick is figuring out which leading indicators actually matter for your specific business. Production cycle times might be huge for manufacturing but useless for a consulting firm, you know?
Nonprofit finances work totally different - you're not trying to please shareholders or anything. Track your program expense ratio first (shoot for 75-85% going straight to programs vs admin). Also watch fundraising efficiency and measure actual impact, not just how many people you served. Don't fall for the overhead myth though - you need some admin spending to function properly! Compare yourself to similar orgs in your space. Pull your last three 990s and make a basic dashboard. Oh and definitely keep an eye on cash flow since that's where nonprofits usually get in trouble.
Look, operational efficiency is basically your fast track to better profits. You streamline stuff, cut waste, optimize how you use resources - boom, lower costs without sacrificing quality. Think of it like... okay, bad analogy but it's kinda like getting your car tuned for better mileage, except the savings hit your profit margins instead. Even if your revenue doesn't budge, those lower operating expenses mean more money in your pocket. Honestly, most businesses have way more fat to trim than they realize. Find your biggest bottlenecks first - that's where you'll see real results fast.
Look, traditional financial reports only tell you what already happened - pretty useless for planning ahead. But with advanced analytics, you can actually predict cash flow issues before they hit and figure out which customers are worth your time. The machine learning stuff is honestly pretty wild at spotting patterns across tons of data points. Real-time dashboards mean you're not waiting around for those painful month-end reports anymore. I'd start small though - pick your biggest financial blind spot and find analytics tools that tackle that specific problem first.
Here's the thing - you're basically driving while staring at the rearview mirror. Historical data shows what already happened, but markets don't care about your spreadsheets from last year. New competitors pop up, economic conditions shift, and suddenly those amazing returns mean nothing. Plus companies can make their numbers look way better than they actually are (hello, creative accounting). I've seen people get burned thinking past performance guarantees future results - it doesn't, especially when things get volatile. You'll want to look at industry trends and what's actually happening now too.
-
Excellent products for quick understanding.