


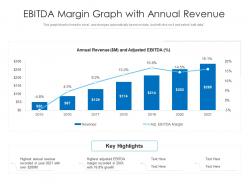
Ebitda margin graph with annual revenue


Try Before you Buy Download Free Sample Product
 Impress Your
 Audience
Editable
of Time


This graph or chart is linked to excel, and changes automatically based on data. Just left click on it and select edit data.
People who downloaded this PowerPoint presentation also viewed the following :
Content of this Powerpoint Presentation
Description:
The image depicts a slide with a title "EBITDA Margin Graph with Annual Revenue." Below the title, a note explains that the graph/chart is linked to Excel and can be updated by editing the data. The chart presents two sets of data: Annual Revenue in millions of dollars (shown through blue bars) and Adjusted EBITDA percentage (shown by a line graph with points).
From left to right, the chart displays years 2015 through 2021. For each year, the revenue is shown as a blue bar, and a data point on the line graph depicts the corresponding EBITDA margin. There appears to be a trend of revenue growth from $50M in 2015 to $285M in 2021. Similarly, EBITDA margins have increased over the years, suffering a drop only in 2015 with -4.8%.
On the bottom left, there are key highlights pointing out that the highest annual revenue was recorded in 2021, with over $280M and the highest adjusted EBITDA margin was recorded in "20XX" with 16.8% growth. The text placeholders "Text Here" suggest that additional information can be added.
Use Cases:
This type of slide is useful across several industries for financial presentations and analysis:
1. Financial Services:
Use: Presenting fiscal health and profitability metrics
Presenter: Financial Analyst
Audience: Investors or Stakeholders
2. Technology:
Use: Showcasing growth trajectory to secure investments
Presenter: Chief Financial Officer (CFO)
Audience: Prospective Investors
3. Healthcare:
Use: Demonstrating financial results in healthcare economics
Presenter: Director of Finance
Audience: Healthcare Administrators or Hospital Board Members
4. Retail:
Use: Annual financial review for retail chains
Presenter: Retail Operations Manager
Audience: Retail Shareholders
5. Manufacturing:
Use: Illustrating the economic state and growth prospects of the manufacturing firm
Presenter: Operations Director
Audience: Industry Partners and Investors
6. Energy:
Use: Reporting financial status to support or justify energy projects
Presenter: Energy Sector Analyst
Audience: Regulatory Agencies or Investment Committees
7. Telecommunications:
Use: Financial performance review in a competitive marketplace
Presenter: Chief Executive Officer (CEO)
Audience: Company Shareholders and Analysts
Ebitda margin graph with annual revenue with all 2 slides:
Use our EBITDA Margin Graph With Annual Revenue to effectively help you save your valuable time. They are readymade to fit into any presentation structure.
FAQs for Ebitda margin graph
So EBITDA margin is pretty straightforward - just EBITDA divided by your total revenue as a percentage. Start with net income, then add back interest, taxes, depreciation and amortization to get your EBITDA number. Then divide by revenue and boom, you've got your margin. It's honestly one of the cleaner ways to see how your actual operations are performing since you're stripping out all the financial engineering stuff. Focus on revenue, cost of goods sold, and operating expenses - but ignore the rest of that noise. I'd track it every quarter though, helps you catch trends before they bite you.
So EBITDA margin cuts out all the interest, taxes, depreciation stuff to show how your core business is actually performing. Gross margin? That's just revenue minus what it costs to make your product. Net profit includes literally everything - which honestly gets confusing fast. Here's how I think about it: gross margin = is your product profitable, EBITDA = are you running things well operationally, net profit = the final number after all the accounting mess. EBITDA's great when you're comparing companies because it doesn't get weird with different financing setups. Way cleaner for analysis.
Tech companies crush it with 30-50% EBITDA margins since there's basically no cost to serve another customer once you've built the software. Real estate and pharma also kill it - different reasons but both have serious pricing power. Retail and manufacturing though? Brutal. Single digits usually because of inventory costs and cutthroat competition. Oh, and here's the thing - don't compare a grocery chain's 3% margin to Google's 25%. That'll just mess with your head. Stick to comparing within the same industry or you'll think every retailer is garbage when they're actually doing fine.
Look at your costs first - way easier than chasing new sales right now. Cut operating expenses by reducing headcount or renegotiating those supplier contracts. Office space consolidation helps too. For COGS, try cheaper materials or streamline production. Honestly, revenue growth is such a pain in this market. Just be smart about what you cut though - you don't want to mess up quality or piss off customers. Oh, and target the stuff that won't hurt your core operations. That's where you'll see the biggest EBITDA bump.
Look, cutting costs is honestly your quickest path to better EBITDA margins. You've got way more control over what you spend versus what comes in. Slash operating expenses - labor, materials, overhead - and boom, more revenue flows straight to your bottom line. Pretty wild how fast it works tbh. Just be smart about where you cut though. Don't hack away at stuff that actually matters. Hunt down inefficiencies first, beat up your suppliers on pricing, automate the boring repetitive stuff. I'd start with your biggest expense categories and see if you can shave 5-10% without breaking anything important.
So EBITDA margin is basically how much cash a company makes before all the boring accounting stuff messes with the numbers. Just divide EBITDA by revenue - higher percentage means they're running things better. What's cool is it cuts through different tax situations and depreciation methods, so you can actually compare companies fairly. I always look at 3-5 years of data to see real trends, not just one weird quarter. If margins keep climbing, management knows what they're doing with costs and pricing. Oh, and definitely compare against competitors in the same industry - that's where you'll spot who's actually winning.
Yeah so here's the thing with EBITDA margins - they totally skip over the expensive stuff companies actually have to pay for. Capital expenditures, working capital changes, all that gets ignored. Plus different accounting methods make company comparisons kinda messy. The real killer though? Some companies look great on EBITDA but their actual cash flow sucks. Tax situations and debt levels aren't factored in either, which is honestly pretty important. I always check how much they're spending on capex and whether they're actually generating real cash. EBITDA can be useful but don't trust it blindly.
So EBITDA margin basically tells buyers how efficient you are at making money. Higher margins = higher valuation multiples because it shows you're not burning cash on operations. Buyers get excited when they see consistent 20%+ margins - means you can scale without costs spiraling out of control. Honestly though, the trend is almost more important than the actual number. Are your margins getting better or worse over time? If you're thinking about selling, definitely focus on showing 2-3 years of stable margins. And have a solid story ready about why your profitability beats competitors. That narrative really matters in negotiations.
So inflation usually hits EBITDA margins pretty hard. Your costs for stuff like labor and materials shoot up right away, but you can't always raise prices immediately - maybe you're locked into contracts or competitors aren't budging yet. It's basically getting squeezed from both directions. Companies with really strong brands or market positions can push through price hikes faster. Most others though? They're gonna feel the pinch for a while. What really matters is how quickly your company can actually get those price increases through vs how much your costs are stuck going up. Some businesses are just better at this dance than others.
Yeah so basically market conditions can totally mess with your EBITDA margins. Strong demand? You'll usually bump prices faster than your costs go up, which is nice. But when things get competitive or the market tanks, you're stuck cutting prices while your fixed costs stay the same - honestly that's the worst combo. Inflation and supply chain issues hit you from the other side too. I'd keep an eye on stuff like how much pricing power you actually have and where your input costs are headed. Way easier to spot margin pressure early than scramble when it's already hurting your numbers.
Your debt-to-equity mix doesn't actually touch EBITDA margins directly - EBITDA sits above interest on the income statement, so it won't reflect your financing choices. But here's the thing: heavily indebted companies often get more aggressive about cutting costs and optimizing operations because they're feeling the heat from debt payments. Management gets way more focused on efficiency when they have those obligations breathing down their neck. So yeah, you might see better margins, but it's really about operational changes rather than the debt structure itself causing it.
Yeah, EBITDA margin works pretty well for comparing across countries since it cuts out the tax and depreciation stuff that varies everywhere. But here's the thing - you still gotta watch out for different labor costs and regulations that'll mess with your numbers. I mean, what looks like poor performance might just be expensive local requirements, you know? It's honestly a decent starting point though. Just don't stop there. You'll want to dig into why the numbers look different between regions. Maybe throw in some other metrics too so you're not flying blind on one measure.
Don't compare EBITDA margins across different industries - that's like comparing apples to oranges. Software companies hit 40% while retail barely scrapes 8%, so context matters. Watch for sneaky "adjusted EBITDA" calculations too (some are honestly ridiculous). High margins don't mean much if the business is tanking overall. Also, EBITDA totally ignores capital spending, which can bite you later. I always look at trends over several quarters instead of obsessing over one number. Oh, and declining companies love to hide behind impressive margins while their revenue falls off a cliff.
Automating stuff can really help your EBITDA margins - you're basically swapping labor costs for efficiency gains. The upfront cash hit is brutal though, not gonna lie. Most repetitive processes become way faster and less error-prone once you automate them. Your payroll shrinks but output usually goes up, which is pretty sweet for the bottom line. Just crunch the numbers on payback period first because timing's everything with cash flow. I've watched companies get burned by not planning that part out properly. Once you're through implementation hell, those savings hit directly where it counts.
Look, there's basically three things that'll move the needle on your EBITDA. First - stop undercharging. Your best clients probably won't even blink at a 15-20% increase if you're delivering solid results. Second thing is getting your operations sorted out. Automate the boring stuff and actually document your processes (I know, sounds boring but it works). Oh, and figure out what makes your most profitable clients tick - like, really dig into those numbers. Training your A-players is huge too. Most companies just wing the talent stuff and wonder why margins suck. Performance bonuses can help keep good people without breaking your budget.
-
Thanks for all your great templates they have saved me lots of time and accelerate my presentations. Great product, keep them up!
-
Editable templates with innovative design and color combination.
-
Great quality slides in rapid time.
-
Enough space for editing and adding your own content.
-
Great quality slides in rapid time.