


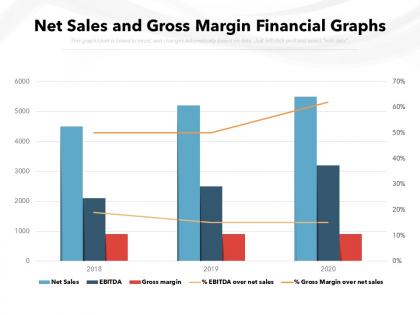
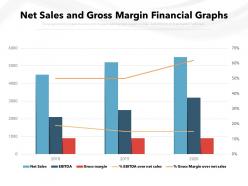
Net sales and gross margin financial graphs




Try Before you Buy Download Free Sample Product
 Impress Your
 Audience
 100%
100% Editable
 Save Hours
 of Time


Our Net Sales And Gross Margin Financial Graphs are explicit and effective. They combine clarity and concise expression.
People who downloaded this PowerPoint presentation also viewed the following :
Net sales and gross margin financial graphs with all 2 slides:
Give your audience a fulfilling experience. They will find our Net Sales And Gross Margin Financial Graphs elevating.
FAQs for Net sales and gross
Honestly, just focus on cash flow, debt-to-equity, and profit margins first - those'll tell you if a company's actually making money and not buried in debt. Current ratio's good for seeing if they can pay short-term bills. ROE shows efficiency pretty well too. Revenue growth sounds impressive but it's kinda useless if everything else is garbage. Oh, and operating margin - that one's underrated because it shows how they handle day-to-day costs. Pull those five metrics and you'll get a decent picture. If they're all moving up, you're probably looking at something solid.
Honestly, macro stuff controls way more of your business than you'd think. Interest rates mess with both your borrowing costs and how much customers actually spend. Inflation? That hits you twice - higher costs for supplies AND you've got to figure out pricing. GDP growth basically tells you if people even want to buy your stuff right now. If you're doing anything international (even just ordering materials from overseas), currency swings can totally wreck your margins. Unemployment affects whether people feel confident enough to spend money. The trick is watching these numbers regularly so you can pivot your forecasts before they screw up your quarterly reports.
Think of financial ratios as your company's health check-up. Inventory turnover tells you if you're sitting on too much stock. Asset turnover shows whether you're actually getting value from all that expensive equipment. Receivables turnover? That's how fast customers pay you back. I'd also track accounts payable turnover - most people skip this one but it shows how well you handle suppliers. Run these numbers monthly and compare them to last quarter plus industry standards. Honestly, catching problems early beats scrambling later when profits tank. Start with your top 3-4 ratios first.
Look, cash flow is your real gut check on whether you can actually keep the lights on. Profits look nice on paper, sure, but if you can't pay rent this month, you're screwed. The timing matters way more than most people think - money coming in vs. going out. I've seen profitable companies go under because their cash timing was garbage. Track your operating cash flow every month (seriously, monthly). Unlike those profit numbers that accountants can massage, cash flow doesn't lie. It's the raw truth about whether you'll survive next quarter.
So basically, raw numbers don't tell the whole story. That 15% profit margin? Could be amazing or terrible depending on your industry. I learned this the hard way when I thought our growth was solid until I saw what competitors were doing. Benchmarking shows you where you're actually winning vs. where you need to step it up. Trade associations usually have decent industry reports, or you can dig into financial databases to compare against similar companies. It's wild how different your performance looks with context.
So with debt, you keep full control but you're stuck making payments no matter what - even if business sucks that month. Equity means giving up some ownership, but there's no pressure to pay investors back on a schedule. When debt works, it's amazing because all the profits stay yours. But man, those fixed payments can kill you during slow periods. Equity investors are way more patient since they only make money if you do. Most companies I know end up mixing both anyway. Really depends on whether your cash flow is predictable enough to handle debt payments without stressing out.
Look, forecasting is basically your business GPS - helps you see where you're actually going instead of just hoping for the best. Once you know your cash flow patterns and can spot revenue trends, decisions become way easier. Should you expand? Cut back? The data tells you. Honestly, I used to think it was this huge complicated thing, but you can start super simple. Just do quarterly projections at first. Even rough numbers beat making choices in the dark. It's not glamorous - mostly just spreadsheets - but it'll save you from some really dumb moves.
Look, non-financial metrics are clutch when you're dealing with startups or high-growth companies. A SaaS company might be bleeding money, but if their customer acquisition costs are plummeting and people aren't churning? That's actually a great sign. I'd focus on these metrics for anything long-term too - employee satisfaction, brand health, that kind of stuff. Financial reports only show what already happened. Something like Net Promoter Score actually predicts where you're headed. Honestly, just pick 2-3 solid non-financial KPIs and track them with your regular financials.
Look, profit margins are like your efficiency report card - they show how much cash you're actually pocketing from every dollar that comes in. There's a massive difference between being busy and being profitable (learned that one the hard way lol). They tell you if a company can control costs and price stuff right. Compare them over time and against competitors to see what's happening. Shrinking margins? Could be pricing wars or they're just spending too much. Short sentences hit different sometimes. But honestly, margins are one of the best ways to see if a business actually has its act together.
Skip the business jargon - nobody wants to decode corporate speak. Regular updates work better than random communication (investors hate surprises). Visual stuff like dashboards beat spreadsheets every time for showing what's actually happening. Here's the thing though - don't sugarcoat the bad news along with the good. People aren't stupid, they'll figure it out anyway. Honestly, I'd start by figuring out what metrics your audience actually cares about first. Then build everything around that. Oh, and keep the language simple in those earnings calls - you want engagement, not glazed-over stares.
Ugh, yeah that's a trap so many companies fall into. When you only chase quarterly numbers, you end up cutting all the important stuff - R&D budgets, training programs, new equipment. Shareholders love it temporarily, but you're screwing yourself over. Innovation tanks, good employees bail for better opportunities, and honestly? Your competitors will eat your lunch while you're counting pennies. Customers start noticing when quality slips too. I'd say try doing like a 70/30 thing - most focus on hitting targets now, but don't completely ignore investing in what'll matter next year.
Yeah, international regs are a double-edged sword for global companies. Compliance costs suck - more reporting, operational tweaks, the usual headaches. But honestly? They can work in your favor too. When everyone has to play by the same rules, companies already doing things right get a competitive edge. Basel III totally shook up banking, same with IFRS for accounting standards. The smart move is staying ahead of these changes instead of panicking when they drop. Way easier said than done though - regulatory shifts can be brutal if you're caught off guard.
Dude, the difference is night and day. Instead of waiting forever for month-end reports, you get real-time data that updates constantly. All that tedious manual stuff? Software handles it now. The AI analytics catch patterns you'd totally miss, and dashboards finally make sense to people outside finance. I love how you can dig into details instantly and build forecasts that actually adjust when new data rolls in. My advice - figure out what's driving you most crazy about reporting right now and tackle that first with one specific tool.
Honestly, dig into your numbers to see what's actually working vs what just looks good on paper. Quarter-over-quarter stuff tells you way more than those big yearly reports - trust me on that one. Figure out which products or customer types are killing it, then throw more resources there. Same with costs - you're probably wasting money somewhere dumb. The real trick is actually doing something with this info though. Like, move budget away from the losers to your winners, or fix your pricing if margins are off. Numbers are useless if you don't act on them.
Just be straight up with your numbers - don't hide the messy stuff or cherry-pick only what looks good. Yeah, nobody wants to be the bearer of bad news, but people need the real story to make decent decisions. Avoid sketchy chart tricks or burying problems in tiny footnotes. Different groups (employees, investors, customers) will react differently, so keep that in mind. Lead with your main insights, call out both wins and problems clearly. Oh and always give enough context so people actually get what they're looking at. Honestly, transparency beats spin every time.
No Reviews