


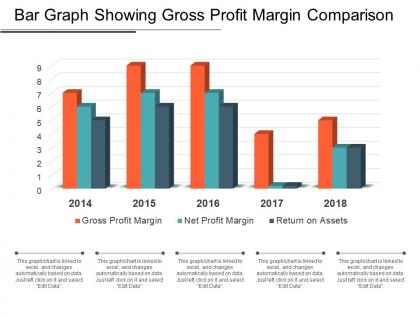
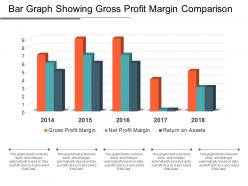
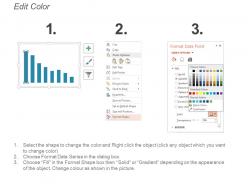
Bar graph showing gross profit margin comparison




Try Before you Buy Download Free Sample Product
 Impress Your
 Audience
 100%
100% Editable
 Save Hours
 of Time


Enhance basic competence with our Bar Graph Showing Gross Profit Margin Comparison. They give you an automatic advantage.
People who downloaded this PowerPoint presentation also viewed the following :
Bar graph showing gross profit margin comparison with all 5 slides:
The apparent becomes actual with our Bar Graph Showing Gross Profit Margin Comparison. Everything takes on a definite form.

FAQs for Bar graph showing gross
Cost of goods and how intense your competition is - those are the big ones. Software companies can hit 80%+ margins since they're mostly paying for upfront development, but manufacturing gets crushed by raw materials and equipment costs. Retail's honestly brutal because you're always fighting on price. Service businesses? Depends how labor-heavy you are. Oh, and newer industries usually start with better margins until everyone piles in. Don't compare yourself to just any company in your space though - you need similar business models or the numbers won't mean anything.
Check out 10-K filings from public companies in your space - the gross margins are right in their income statements. IBISWorld has solid industry reports but they're expensive as hell. Trade associations sometimes publish benchmarking stuff that's actually useful. Here's the annoying part though: companies calculate gross profit all sorts of ways depending on what they throw into COGS. So you can't just compare random numbers and call it a day. Stick with businesses that are roughly your size and model. Otherwise you're basically comparing a corner store to Walmart, which doesn't help anyone.
Honestly, pricing is your biggest knob to turn for profit margins. Same costs, higher price = way better margins. Look at Apple - they charge crazy premiums but people still buy because of the brand and quality perception. You just can't jack up prices randomly though. Customers need to see the value. I'd check what competitors are charging first, then maybe test small bumps to see how price-sensitive your buyers actually are. Finding that sweet spot is tricky but it's where the money is. Don't leave cash on the table if people will pay more.
Check your gross profit margins - that's where you'll find the money leaks. I'd compare margins between different products and time periods to see what's actually working. Like if one product hits 60% margins but another's stuck at 20%? Something's definitely off there. Could be supplier costs, pricing issues, or honestly both at the same time. The trick is pulling this data monthly so you catch problems before they get worse. Look for patterns that point to specific fixes you can actually make. It's pretty eye-opening once you start tracking it consistently.
Honestly, the worst thing is when companies can't decide what actually goes in COGS. Like some throw shipping costs in there, others don't. Labor gets weird too - is it part of production or not? Pick a lane and stay in it. Watch out for those random inventory write-offs that'll make your margins look terrible for no real reason. Also don't compare Q4 to Q1 margins without thinking about seasonality - learned that one the hard way. Just document whatever method you pick and stick with it religiously.
Yeah, raw material costs can totally mess with your margins since they hit your cost of goods sold directly. Steel prices are the worst - I've watched companies drop from 40% margins to break-even in one quarter. The timing kills you because you can't always raise prices right away, especially with existing contracts. Competitive pressure doesn't help either. You're kinda stuck absorbing the hit initially. I'd build some cushion into your pricing upfront and maybe look into hedging for your biggest materials. It's not foolproof but beats getting blindsided every time.
Gross profit margin tells a really good story about how efficient you're running things. I'd show trend lines across several quarters - investors love seeing that upward trajectory. Compare yourself to competitors too, especially where you're crushing it. Break it down by product lines if you can, analysts get excited about that granular stuff for some reason. Frame it in your growth story like "margins jumped 200 basis points while we scaled revenue 40%." That's the kind of thing that gets people's attention. Just be ready to explain what's driving those changes and where you think things are headed.
Ugh, seasonal demand is such a pain for margins. Peak season hits and you'd think you're golden, but margins actually get squeezed - everyone's discounting to move volume plus suppliers jack up costs. Off-season is worse though. All that leftover inventory? You're practically giving it away. Winter coats in July are going straight to the clearance rack, no question. Track your margins monthly instead of just yearly averages - trust me on this. Makes planning way easier when you can see the patterns coming. Then you won't get caught off guard with your buying and pricing decisions.
Okay so when your gross profit margin keeps dropping quarter after quarter, it basically means your costs are climbing way faster than your revenue is growing. Could be supply chain stuff getting expensive, or maybe competitors are forcing you to cut prices - that's always brutal. Sometimes it's just weird market conditions that'll pass, but honestly you can't just hope it goes away. Break down your costs and compare them quarter to quarter. That'll show you what's actually eating into your margins. Then you'll know if it's something you can fix internally or if the whole market dynamic is shifting on you.
So here's what I'd do - calculate your gross profit margin for each product line (revenue minus costs, divided by revenue). Rank them from highest to lowest. Your high-margin stuff? That's paying the bills and then some. The low performers are honestly just eating up resources at this point. Focus your marketing budget on pushing the winners harder. Maybe phase out the duds unless there's some strategic reason to keep them around. Oh, and don't compare like electronics to clothing or whatever - stick to similar categories so you're not comparing totally different beasts.
Dude, high gross margins are actually gold for startups. Investors go crazy for that stuff because it shows you can price well and aren't bleeding money on every sale. Plus you get this cushion to mess up (and you will) without instantly dying. Each transaction brings in decent cash after covering your direct costs, which is honestly the dream. The catch? Don't get all excited about 80% margins if you're only selling like 10 units a month. Scale matters too. But yeah, protect those margins as you grow - they're your safety net when things get weird.
Currency swings can totally wreck your profit margins when you're doing business internationally. Say you're selling stuff in euros but buying materials in dollars - those rate changes hit you right in the wallet. Your home currency gets stronger? Great, now your exports cost more and customers bail. Gets weaker? Now you're paying through the nose for imports. Honestly, the timing aspect is probably the worst part since there's usually weeks between setting prices and actually getting paid. You should definitely track your exposure and maybe hedge the big deals, but yeah - it's a headache either way.
So margins basically show you which products actually make money vs. the ones just breaking even. Focus your marketing budget on high-margin stuff - that's where you'll see real returns. Low-margin products? Maybe ease up on promoting those unless you're just trying to get customers in the door. I learned this the hard way when I kept pushing a product that looked popular but was barely profitable. Now I always check margins before any big campaign launch. You can also use this data to figure out what you can afford to discount. Trust me, run these numbers first - you might be surprised which products are your actual goldmines.
So basically when labor costs go up, your margins get squeezed hard since wages are baked into your production costs. You can't always raise prices right away either - customers hate that. Manufacturing is brutal that way. Track your labor cost per unit obsessively, that's your lifeline. Then you've got a few moves: push for price increases with customers, automate what you can, or completely rethink how you're making stuff. Automated operations handle this way better than labor-heavy ones, obviously. The efficiency gains route usually takes time though, so plan ahead.
So tech definitely helps boost profit margins in service businesses - mainly by cutting labor costs and speeding things up. Like, accounting firms using tax software instead of doing everything by hand? Game changer for their margins. Here's what I'd do: map out where you're spending the most on labor first. Then find tech that tackles those exact pain points. Don't get distracted by fancy features that look cool but won't actually move the needle on costs. The trick is automating the boring, repetitive stuff while keeping your service quality solid. I've seen companies mess this up by going too broad with their tech choices.
-
Content of slide is easy to understand and edit.
-
Amazing product with appealing content and design.