


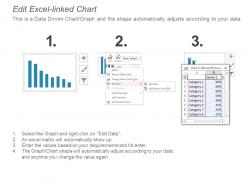
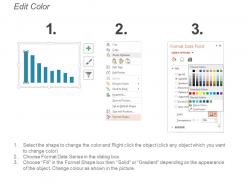
Bar graph showing sales and gross profit margin highlights




Try Before you Buy Download Free Sample Product
 Impress Your
 Audience
 100%
100% Editable
 Save Hours
 of Time


Our Bar Graph Showing Sales And Gross Profit Margin Highlights guarantee fascination. They generate endless delight.
People who downloaded this PowerPoint presentation also viewed the following :
Content of this Powerpoint Presentation
Are you new to the business or, like many business owners, do not have a proper accounting background? Then terms like sales margin, gross profit margin, and net profit are mere numbers to you. However, as a business owner, you need to learn a lot more about these terms as they help to determine the financial health of your company. Businesses and individuals all over the world perform financial activities to make a profit. Different quantitative measures are used to compute the profits and losses generated by a business.
Gross profit, sales margin, and net profit are financial metrics that are beneficial in assessing your business performance across multiple periods and comparing it with your competitors.
Gross profit margin is a good yardstick to measure the efficient money-making of businesses from their products and services. It helps set the selling price of a product or service alongside competitive analysis. Though financial analysts and investors use percentages, business owners value gross profit margin figures more. With these figures, they can calculate the available money for paying off debts, covering overhead costs, and delivering shareholder distributions.
Net income and profit from all business operations are crucial for the successful growth of a business. To get an overview of the topic, click here and get unique PowerPoint slides highlighting net income and profit margin.
Bar Graph displaying Sales and Gross Profit Margin PPT Templates
SlideTeam has presented 100% customizable slides on "Sales and Gross Profit Margin" with different nodes and colors. The colorful bar chart explains every aspect of the profit margins in an understandable way. Entice your audience with vibrant designs and expertly created icons crafted in each slide. Get a deeper dig into the realm of financial expertise with our well-organized Google-compatible slides.
A monthly comparison of profit margins is essential for a business's smooth running. Click here to Download the best PPT slides showing monthly comparison graphs to help your employees compare the profit margins generated every month.
Template 1: Bar Graph showing Sales and Gross Profit Margin Highlights
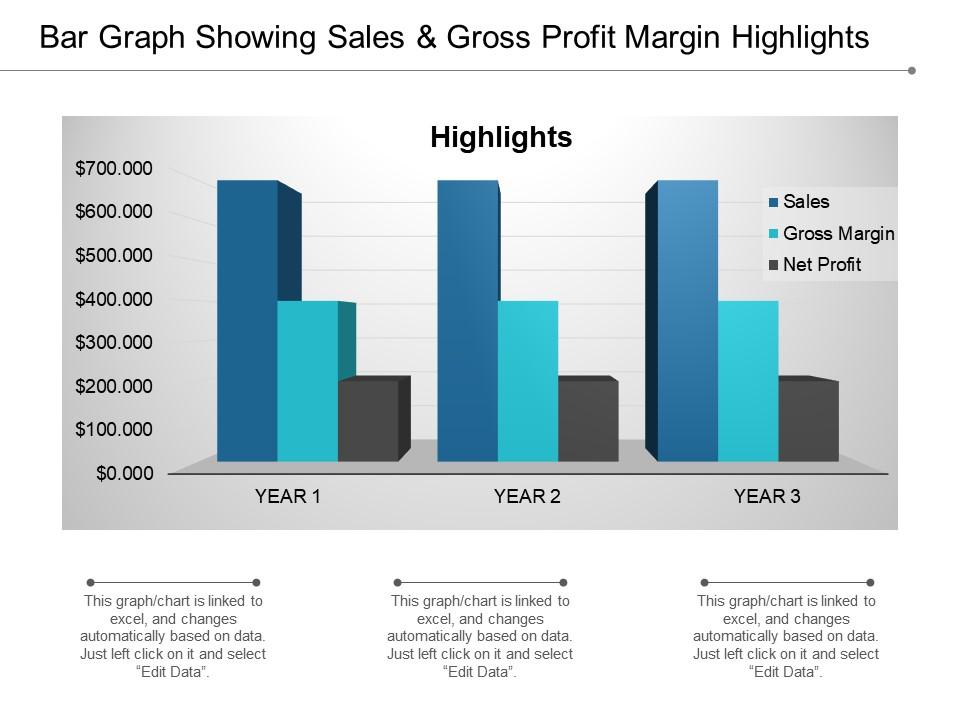
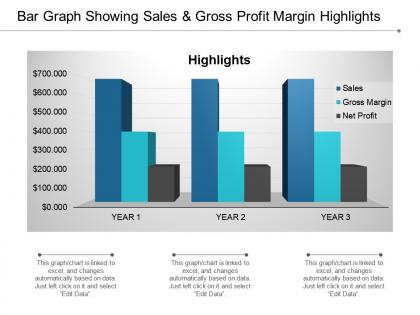
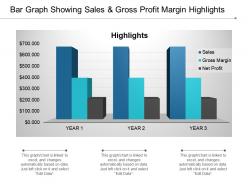
Gross margin is a financial metric that helps measure the effectiveness of a business in transforming materials, goods, and direct labor into profit. To make your job easier, we are presenting our sales and gross profit margin highlights through a well-designed bar chart that guarantees fascination. Make a memorable impact with this visual marvel and shape your story with this colorful bar chart showcasing sales, gross margin, and net profit for years 1, 2, and 3. Let your financial knowledge shine through our PPT preset and make a long-lasting impression on your client base.
Generate Endless Delight with these Professionally-curated PPT Templates
If you are an investor, then you must look at some of the significant financial metrics to make well-informed decisions about different business houses before adding to your portfolio. SlideTeam's captivating PowerPoint template is a versatile tool to convey financial information and the position of your company in a visually engaging manner. Whether you are a financial analyst, business executive, or a professional, these templates cater to all individual requirements.
Also, Click here to access the premium "Operating Profit Margin Dashboard with Income Statement and Expenses" to estimate any organization's profit.
Bar graph showing sales and gross profit margin highlights with all 5 slides:
Fight any form of inequality with our Bar Graph Showing Sales And Gross Profit Margin Highlights. It helps establish a fair environment.
FAQs for Bar graph showing sales and gross
Track your revenue trends and gross margins first - that's your baseline. Customer acquisition costs matter way more than people think, plus average order value and conversion rates. Those show if you're actually efficient at making money. Seasonal stuff will bite you if you ignore it (learned that one the hard way). Break down profit by product or service too because some things look great revenue-wise but destroy your margins. Honestly, just build something simple you'll check every week instead of some fancy thing you'll never look at.
Honestly, seasonal trends will totally mess up your forecasts if you ignore them. You get these crazy spikes during holidays or back-to-school season - sales go up but margins get squeezed from all the competition and discounts. Winter coats in July? Good luck with that. But swimwear flies off the shelves. The trick is digging into your past sales data to find these patterns. Plot out your monthly numbers from the last 2-3 years and you'll start seeing the trends. Then you can actually plan your inventory and pricing instead of just winging it every quarter.
So customer segmentation is like having a map of who's actually making you money. Break down your sales by age groups, buying habits, or how much people spend - you'll probably be shocked by what you find. Most people just look at overall numbers, but that hides the real story. Some customer groups might be killing it while others are tanking, and you'd never know without digging deeper. I'd start with your top 20% revenue customers first. Compare how they buy stuff versus everyone else. That's where the gold is - spotting trends before they become obvious problems.
Grab your sales data from the past 2-3 years and chart it out monthly - you'll start seeing patterns jump out at you. Peak seasons, slow periods, which products actually made you money. I swear once you dig into it, the story becomes super obvious! Check your year-over-year growth too. What I'd do is look at customer behavior alongside market conditions from those periods. You can spot trends in buying cycles and use that stuff to predict what's coming next. Honestly beats just guessing based on gut feeling, which is what I used to do.
Start with Excel or Google Sheets - seriously, pivot tables still handle most analysis stuff you'll need. Power BI and Tableau are solid if you want fancier dashboards, but they cost more. Google Analytics tracks profit automatically if you're doing e-commerce, which is pretty convenient. Honestly? Don't overthink it at first. Master whatever feels comfortable before jumping to expensive tools. I made that mistake early on and wasted time learning software I didn't actually need. Build your skills with one tool, then upgrade when things get more complex.
Dude, external economic stuff will hit your business in ways you don't see coming. Inflation drives up your costs while customers get super picky about prices - honestly, it's brutal. People ditch non-essentials first when recession hits. Interest rates mess with your financing AND whether customers can afford big purchases. Remember all that supply chain chaos? That can double your costs overnight. If you're importing anything, currency swings will screw with your numbers too. Build some cushion into your forecasts and have backup plans ready. Trust me, you'll need them way sooner than you think.
Ugh, where do I even start? Don't analyze dirty data - you'll just get garbage results. Vanity metrics are useless if they don't actually help you decide anything. People always forget about seasonality and market shifts when looking at sales numbers, which drives me crazy. Customer acquisition costs get ignored way too often. Also, stop cherry-picking timeframes to make yourself look good! You can't compare different product lines like they're the same thing. Segment by customer type and location or you're missing huge insights. But honestly? Just ask yourself what decision you're trying to make first.
Dude, visuals are a game changer for spotting trends. Your brain just gets patterns way faster than scanning through endless spreadsheet rows. Line charts show you growth over time, bar charts let you compare different regions - that kind of thing. I've literally caught issues on dashboards that I totally missed in the raw data. Seasonality jumps out at you immediately. Same with weird dips or spikes that would've taken forever to notice otherwise. Start simple with basic line and bar charts for your monthly stuff. You'll be shocked how clear everything becomes when it's actually visual instead of just numbers.
Dude, you absolutely need to compare your sales across different time periods. Here's why - one month of data is basically useless on its own. You won't know if you're actually growing or just hit a lucky streak. Month-over-month and year-over-year comparisons show you real trends, help you catch issues early, and figure out what's actually working. Seasonal stuff can be super misleading otherwise. Like, December might look amazing but maybe it's just normal holiday sales, you know? Without comparing periods, you're just guessing about your business performance. Trust me on this one.
Track your conversion rates first - they're super easy to check and tell you a lot. Also watch average deal size, how long your sales cycle takes, and what you're spending to get each customer. Revenue per rep is clutch too, shows if people are actually getting better at their jobs. Compare everything month-to-month, not just random snapshots. Weekly team reviews work great if you can swing it. Oh and honestly? A basic dashboard beats fancy analytics that nobody looks at. You'll catch problems way faster when the data's right there.
Ugh, forecasting is such a pain because everything's constantly changing on you. Customer behavior shifts overnight, and then your historical data becomes pretty much worthless. Seasonal stuff throws you off, competitors do random things you can't see coming, and don't even get me started on economic factors - totally out of your hands. Internal chaos doesn't help either - new products launch, teams get reshuffled, whatever. I've found the trick is making your models super flexible instead of treating them like gospel. Update them all the time. Honestly, forecasts are more like educated guesses anyway.
Pull your sales data from last quarter and look for the real patterns. Which products are actually making you money? I always find there's at least one thing you think is profitable that's secretly bleeding cash. Focus on your top 3 money-makers first. Then check what customers are buying vs. what you assumed they wanted - that gap is usually huge. If something's underperforming, either fix the pricing or just cut it loose. Don't get emotional about dead weight. Move your budget toward the winners and be brutally honest about what the numbers actually say.
Ugh, competition is brutal - you're constantly tweaking prices and trying to figure out where you fit in the market. Sometimes you'll have to cut margins just to keep customers from jumping ship. Other times you can actually charge more if you've got something unique they want. Resource allocation gets tricky too because you're always chasing the next advantage while avoiding oversaturated markets (learned that one the hard way). The key is staying on top of what everyone else is doing. Honestly, it means your sales forecasts are basically educated guesses that change every quarter.
Look, sales data tells you which stuff is flying off the shelves and what's just sitting there forever. I check mine monthly now - total game changer. You can see patterns pretty quick, like what to stock up on vs. what needs to go. The seasonal thing is huge too. Order your winter stuff early before everyone else panics and you're scrambling. My cousin learned this the hard way last year with boots. Stop guessing what people want and just look at what they're actually buying. Use that info for your next order instead of going with your gut every time.
Profit margins are basically your safety net for pricing moves. Good margins? You can afford to get aggressive with discounts without totally screwing yourself. But if your margins are already razor-thin, any price cuts will straight up hurt. When margins are tight though, you gotta think outside the box - maybe add value instead of dropping prices. I've seen people get way too focused on just cutting prices when there's other options. Check which products give you the most room to play with before making any moves. Trust me, do the math first or you'll regret it later.
-
Easily Editable.
-
It saves your time and decrease your efforts in half.