

Profit and loss presentation background images





Try Before you Buy Download Free Sample Product
 Impress Your
Audience
 100%
Editable
 Save Hours
of Time


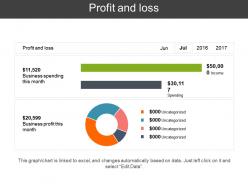
Create a comprehensive profit and loss statement with the help of this Profit and Loss Presentation Background Image without any hassle. With this readily available profit and loss PPT template, present the revenue to gauge upon the financial status of your organization. Showcase the financial position of the company to the investors and the other shareholders with the help of this professionally designed PowerPoint slide. Convey the simplified version of your information to the audience with this profit and loss PowerPoint template. This PowerPoint slide contains refined data and is professionally designed and is editable for your convenience. With high-quality content and graphics used in this PPT slide, enhance the way you present your PowerPoint presentation. Get this profit and loss sheet PPT slide to generate an effective PowerPoint presentation in less time.
People who downloaded this PowerPoint presentation also viewed the following :
Profit and loss presentation background images with all 5 slides:
Convince folks that you are certain of the facts with our Profit And Loss Presentation Background Images. It helps express conviction.


FAQs for Profit and loss
Start with your reporting period and key assumptions right up front. Business context is huge - what was actually happening that explains the numbers? I learned this the hard way after getting bombarded with questions I could've avoided. Call out one-time stuff, seasonal weirdness, or any accounting changes that mess with comparisons. If you're doing non-GAAP adjustments, explain your methodology so nobody gets confused. Oh, and definitely lead with your biggest story first - people have short attention spans and need to know what actually matters here.
Honestly, color choice makes such a difference with financial stuff. Red screams "danger" so it's perfect for losses - people get that instantly. Green feels safe and positive, which is why everyone uses it for profits. For general financial health stuff, blue works great since it feels trustworthy and stable. I made this embarrassing mistake once where I used bright yellow for losses and my boss was like "why does our debt look so happy?" lol. Don't pick colors that fight against your message - like using cheerful orange for serious debt problems. Just go with what feels natural and matches the vibe of your numbers.
Clean backgrounds are your friend - white, light gray, maybe a subtle gradient. Don't go crazy with patterns that'll fight your data for attention. Stick with the classic red/green thing for losses and profits, then use those colors consistently throughout. I swear, some people think rainbow charts look "creative" but they just confuse everyone. Make your fonts big enough so people in back can actually read them. Give everything room to breathe with white space. The whole point is making financial stuff easy to scan quickly, you know?
Honestly, yeah you should totally brand those P&L slides. Your execs need to see this as *your company's* financial story, not some random spreadsheet dump. I've been in way too many meetings where slides look like they're from completely different companies - it's weird and unprofessional. Consistent colors and fonts make your numbers feel more legit and trustworthy. Oh, and throw your logo on there but keep it subtle. The key is clean branding that doesn't compete with your actual data. Nobody wants to squint through flashy graphics to find the revenue numbers, you know?
Honestly, visual charts will save your life here. People's eyes just glaze over when they see spreadsheet rows - but show them a clean bar chart of quarterly revenue? Game changer. Line graphs work great for showing trends over months, and waterfall charts are perfect when you need to explain how numbers moved from one period to another. Skip pie charts though, they're kind of played out unless you really need them. The trick is matching your chart type to whatever story you're trying to tell. Don't just dump graphs everywhere because you can.
Honestly, templates are a game changer for P&L presentations. You'll save so much time since you're not starting from zero every quarter - just drop in your numbers and boom, you're mostly done. Everything stays consistent too, which makes you look way more professional than slapping together random slides. Your stakeholders will know exactly where to find the important stuff if you're presenting to the same people regularly. I always start with revenue, expenses, and key ratios, then tweak it for whatever industry you're in. Trust me, once you have a solid template, you'll wonder how you ever did it without one.
Don't go crazy with busy backgrounds - they'll just make your numbers impossible to read. Honestly, I cringe whenever I see presentations with wild gradients and flashing animations everywhere. Stick with clean stuff like white, light gray, maybe a soft blue. Bright colors and low contrast combinations? Your executives will hate trying to squint at those P&L figures. Oh, and definitely avoid tiny fonts - people need to actually scan the data quickly. The whole point is letting your financial info stand out, not competing with some cluttered design that screams "look at me!" Keep it professional and simple.
Honestly, just think about what each group actually wants to hear. Investors care about the big story - market stuff, how you stack up against competitors, what's driving growth. Internal teams? They want the nitty-gritty operational details, like which departments did what and why you moved budget around. I always make investor decks way cleaner (trust me, they don't want to see every single line item). Internal ones can get messy with all the operational weeds. Pro tip that's saved me tons of time: make templates for each type so you're not rebuilding everything from scratch each month.
For P&L stuff, go with charts and graphs - bar charts, line graphs, basic financial icons. Clean visuals that don't fight your data for attention. Honestly, I cringe every time I see those cheesy handshake stock photos in financial presentations. What's the point? Use simple arrow icons for trends, maybe some calculator imagery, or just geometric shapes in your company colors. Subtle backgrounds work best. You'll want to use icons sparingly - just for key metrics or breaking up sections. The whole point is making your numbers shine, not creating a visual mess.
Look, your P&L needs to tell a story, not just list numbers. Give context first - what was happening in the market or with your strategy? Then walk through how that actually impacted revenue and costs. I love using "challenge-action-result" because it flows naturally. So instead of just "sales dropped 15%," explain the new competitor situation, your response (customer retention programs), and the outcome (protected margins despite lower volume). Honestly, this approach makes everything click better for readers. Wrap up each section by tying it back to your bigger strategy and what's next.
Honestly, just start with Excel or Google Sheets - they're perfect for the actual number crunching. Canva's got some decent financial templates if you want it to look nice without tons of work. PowerBI and Tableau are way too much unless you're doing crazy data stuff (which it sounds like you're not). PowerPoint works fine for presentations too. My usual move is build it in Excel first, then make it pretty in whatever design tool I actually know how to use. Oh and don't overthink it - most people just care that the numbers add up correctly anyway.
Yeah, cluttered backgrounds are the worst - people end up squinting at tiny numbers instead of actually listening to you. Clean sections work way better. Guide their eyes from revenue straight down to the bottom line, you know? I've honestly seen some P&L slides that look like total spreadsheet disasters. Give your key metrics room to breathe with white space, keep your quarters lined up consistently, and make those profit/loss numbers really stand out. It's basically like drawing someone a map - they shouldn't have to hunt around wondering what you're even talking about.
Honestly, everyone's moving toward super clean backgrounds now - minimal stuff that doesn't fight with your actual data. We're talking subtle gradients, muted tones, tons of white space. Those busy corporate templates from like 2010? Yeah, they're dead. Dark mode is pretty much expected too since most execs seem to love it. The whole point is letting your numbers shine instead of some fancy background stealing attention. I'd probably cut your decorative elements by 70% and go way softer on colors. Your profit margins should be the star, not whatever clipart you've got lurking around.
Dude, visuals are everything for P&L presentations - like 80/20 rule with charts vs text. I literally watched a room of VPs zone out when someone dumped raw spreadsheets on them once. Pretty brutal. Focus on the big variances and trends that actually matter, not every tiny line item. Bullet points work way better than paragraphs. Your audience needs to get the story in 30 seconds max per slide. Commentary should be short and punchy - headlines, not essays. Let your graphs do the talking while text just fills in the gaps.
Dude, go with subtle financial backgrounds - soft blues, grays, maybe some clean geometric stuff. Nothing crazy though. I've actually noticed Buffett's reports got way more visual lately, which is wild. But seriously, don't let your background kill the actual numbers. That's the whole point, right? Some people do these minimalist stock chart watermarks or little upward arrows that look pretty sharp. Just keep it classy - I saw this one presentation where they went overboard with colors and it was a mess. Your CFO will love you if the data actually stands out instead of fighting with some busy design.
-
Informative design.
-
Content of slide is easy to understand and edit.