

Profit and loss powerpoint template slide





Try Before you Buy Download Free Sample Product
 Impress Your
Audience
 100%
Editable
 Save Hours
of Time


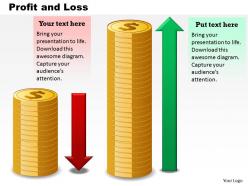
Summarizes your business revenues or incomes and cost or expenses in style though our professionally drafted PPT design on profit and loss PowerPoint template slide. Use this PowerPoint design to highlight the profit and loss statement of your company for a specific period of time which helps your investors and customers to know about the financial well being of your business. You can use this PPT model to define that it is the one of the financial statements which every company needs to represent every quarter or half yearly or annually towards its investors , boards and management .Whereas you can describe the significance of the income statement with our PPT diagram such as it works as an important management tool ,helps in projecting the business future revenues, helps in controlling as well as managing the excessive company expenses, depicts the company’s financial performance and many more. Thus start initializing this impeccable Presentation slide to represent your organizations economic situation.Bounce your beliefs off our Profit And Loss Powerpoint Template Slide. The audience will echo your feelings.
People who downloaded this PowerPoint presentation also viewed the following :
Profit and loss powerpoint template slide with all 5 slides:
Better the best with our Profit And Loss Powerpoint Template Slide. Your thoughts will smoothly overtake competition.


FAQs for Profit and loss
An effective profit and loss template should include revenue streams, cost of goods sold, operating expenses, gross and net profit margins, tax obligations, and period-over-period comparisons. These elements enable businesses to track financial performance comprehensively, identify cost reduction opportunities, and make strategic decisions, with many organizations finding that standardized templates streamline reporting processes and enhance stakeholder transparency.
A profit and loss template helps financial forecasting by providing structured frameworks for projecting revenues, expenses, and net income across multiple time periods. These templates enable businesses to analyze historical trends, model different scenarios, and identify potential cash flow challenges, with many organizations finding that systematic P&L forecasting enhances budget accuracy and strategic decision-making.
Common mistakes include mixing personal and business expenses, incorrect revenue timing, omitting depreciation costs, inconsistent categorization, and failing to reconcile accounts regularly. These errors compromise financial accuracy and decision-making, with many businesses finding that standardized templates and monthly reviews streamline reporting processes, enhance investor confidence, and ultimately deliver clearer insights for strategic planning and operational efficiency.
Businesses can customize profit and loss templates by adjusting revenue categories, expense classifications, and industry-specific line items to match their operational structure and regulatory requirements. Companies in retail, healthcare, or manufacturing often modify templates to include sector-specific metrics like inventory costs, patient revenue streams, or production expenses, ultimately delivering more accurate financial insights and enhanced strategic decision-making capabilities.
Financial ratios transform profit and loss data into actionable insights by measuring profitability, efficiency, and operational performance through metrics like gross margin, operating ratio, and net profit margin. These ratios enable businesses to benchmark against industry standards, identify cost structure inefficiencies, and track performance trends over time, ultimately delivering strategic clarity for decision-making and competitive positioning.
Profit and loss statements should be updated monthly for optimal accuracy, with many organizations also generating quarterly and annual versions for comprehensive analysis. Monthly updates enable businesses to track performance trends, identify seasonal variations, and make timely strategic adjustments, while quarterly reports facilitate investor communications and annual statements support tax planning and long-term forecasting.
Single-step profit and loss templates calculate net income by subtracting total expenses from total revenues in one calculation, while multi-step templates separate operating and non-operating activities through multiple calculation stages. Multi-step formats provide greater detail for management analysis and investor decision-making, with many manufacturing and retail organizations finding that the enhanced categorization enables better cost control and operational performance tracking.
A profit and loss template assists in identifying cost-saving opportunities by categorizing expenses, highlighting spending patterns, and enabling comparative analysis across periods and departments. Through detailed expense breakdowns, businesses can pinpoint inefficiencies in operational costs, vendor relationships, and resource allocation, with many organizations finding that systematic P&L analysis reveals 10-15% potential savings in administrative and overhead expenses.
**INPUT**: What tools or software can enhance the usability of a profit and loss template? **OUTPUT**: Tools that enhance P&L template usability include Excel with pivot tables, Google Sheets for collaboration, QuickBooks for automated data integration, Power BI for visualization, and specialized templates from platforms like SlideTeam. These solutions streamline financial reporting by automating calculations, enabling real-time collaboration, and providing professional formatting, with many finance teams finding that integrated dashboards ultimately deliver faster month-end closes and more strategic decision-making capabilities. [Word count: 60]
Visual aids improve profit and loss statement understanding by transforming complex financial data into charts, graphs, and infographics that highlight trends, comparisons, and key performance indicators at a glance. These visual elements enable stakeholders to quickly identify revenue patterns, expense categories, and profitability drivers, while enhancing presentations to investors and management teams, ultimately delivering clearer financial communication and faster decision-making across organizations.
Inventory management significantly impacts the P&L through cost of goods sold, carrying costs, and working capital efficiency. Poor inventory control increases storage expenses, obsolescence write-offs, and cash flow constraints, while optimized management reduces COGS, minimizes waste, and enhances gross margins, ultimately delivering improved profitability and operational efficiency for growing businesses.
Businesses leverage historical P&L data by identifying revenue trends, cost patterns, seasonal fluctuations, and profit margin variations to inform future strategies and resource allocation. This analysis enables companies to make data-driven decisions about budget planning, investment priorities, and operational adjustments, while many organizations find that examining multi-year P&L trends helps predict market opportunities and optimize financial performance.
Best practices for presenting a profit and loss template to stakeholders include using clear visual hierarchies, highlighting key performance indicators, providing comparative data across periods, and focusing on variance analysis with actionable insights. These approaches streamline financial communication by emphasizing trends rather than raw numbers, contextualizing performance against budgets and forecasts, ultimately delivering transparency that enables informed strategic decisions.
Seasonal trends significantly influence P&L components through fluctuating revenue patterns, variable operating expenses, and shifting inventory costs that directly correlate with peak and off-peak periods. Retail businesses experience higher sales during holidays while facing increased marketing and staffing costs, with many organizations finding that strategic seasonal planning enables better cash flow management, optimized resource allocation, and ultimately enhanced annual profitability despite quarterly variations.
A profit and loss template supports regulatory compliance by standardizing financial reporting formats, ensuring consistent data categorization, and maintaining comprehensive audit trails across all transactions. These templates help organizations streamline regulatory submissions, enhance financial transparency, and minimize compliance risks, with many financial institutions and public companies finding that structured P&L formats significantly reduce reporting errors while accelerating regulatory review processes.
-
Illustrative design with editable content. Exceptional value for money. Highly pleased with the product.
-
Great experience, I would definitely use your services further.