Powerpoint Templates and Google slides for Gross Margin
Save Your Time and attract your audience with our fully editable PPT Templates and Slides.
-
 Highlights gross margin net income operating expenses
If you require a professional template with great design, then this Highlights Gross Margin Net Income Operating Expenses is an ideal fit for you. Deploy it to enthrall your audience and increase your presentation threshold with the right graphics, images, and structure. Portray your ideas and vision using twelve slides included in this complete deck. This template is suitable for expert discussion meetings presenting your views on the topic. With a variety of slides having the same thematic representation, this template can be regarded as a complete package. It employs some of the best design practices, so everything is well-structured. Not only this, it responds to all your needs and requirements by quickly adapting itself to the changes you make. This PPT slideshow is available for immediate download in PNG, JPG, and PDF formats, further enhancing its usability. Grab it by clicking the download button.
-
 Sales and profit gross profit commission variable cost growth analysis
Engage buyer personas and boost brand awareness by pitching yourself using this prefabricated set. This Sales And Profit Gross Profit Commission Variable Cost Growth Analysis is a great tool to connect with your audience as it contains high-quality content and graphics. This helps in conveying your thoughts in a well-structured manner. It also helps you attain a competitive advantage because of its unique design and aesthetics. In addition to this, you can use this PPT design to portray information and educate your audience on various topics. With twelve slides, this is a great design to use for your upcoming presentations. Not only is it cost-effective but also easily pliable depending on your needs and requirements. As such color, font, or any other design component can be altered. It is also available for immediate download in different formats such as PNG, JPG, etc. So, without any further ado, download it now.
-
 Curved timeline data analytics business development gross profit
Deliver a lucid presentation by utilizing this Curved Timeline Data Analytics Business Development Gross Profit. Use it to present an overview of the topic with the right visuals, themes, shapes, and graphics. This is an expertly designed complete deck that reinforces positive thoughts and actions. Use it to provide visual cues to your audience and help them make informed decisions. A wide variety of discussion topics can be covered with this creative bundle such as Curved Timeline, Data Analytics, Business Development, Gross Profit. All the twelve slides are available for immediate download and use. They can be edited and modified to add a personal touch to the presentation. This helps in creating a unique presentation every time. Not only that, with a host of editable features, this presentation can be used by any industry or business vertical depending on their needs and requirements. The compatibility with Google Slides is another feature to look out for in the PPT slideshow.
-
 Comparison progress gross revenue operating profits market share
Introduce your topic and host expert discussion sessions with this Comparison Progress Gross Revenue Operating Profits Market Share. This template is designed using high-quality visuals, images, graphics, etc, that can be used to showcase your expertise. Different topics can be tackled using the eleven slides included in this template. You can present each topic on a different slide to help your audience interpret the information more effectively. Apart from this, this PPT slideshow is available in two screen sizes, standard and widescreen making its delivery more impactful. This will not only help in presenting a birds-eye view of the topic but also keep your audience engaged. Since this PPT slideshow utilizes well-researched content, it induces strategic thinking and helps you convey your message in the best possible manner. The biggest feature of this design is that it comes with a host of editable features like color, font, background, etc. So, grab it now to deliver a unique presentation every time.
-
 Gross profit margin analysis ppt powerpoint presentation portfolio skills cpb
Presenting this set of slides with name Gross Profit Margin Analysis Ppt Powerpoint Presentation Portfolio Skills Cpb. This is an editable Powerpoint one stages graphic that deals with topics like Gross Profit Margin Analysis to help convey your message better graphically. This product is a premium product available for immediate download and is 100 percent editable in Powerpoint. Download this now and use it in your presentations to impress your audience.
-
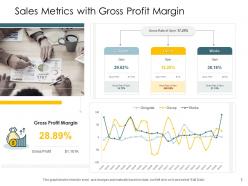 Sales metrics with gross profit margin
Presenting this set of slides with name Sales Metrics With Gross Profit Margin. The topics discussed in these slides are Gringotts, Osccp, Works. This is a completely editable PowerPoint presentation and is available for immediate download. Download now and impress your audience.
-
 Gross Margin Contribution Margin In Powerpoint And Google Slides Cpb
Presenting our Gross Margin Contribution Margin In Powerpoint And Google Slides Cpb PowerPoint template design. This PowerPoint slide showcases three stages. It is useful to share insightful information on Gross Margin Contribution Margin. This PPT slide can be easily accessed in standard screen and widescreen aspect ratios. It is also available in various formats like PDF, PNG, and JPG. Not only this, the PowerPoint slideshow is completely editable and you can effortlessly modify the font size, font type, and shapes according to your wish. Our PPT layout is compatible with Google Slides as well, so download and edit it as per your knowledge.
-
 Net Margin Gross Margin In Powerpoint And Google Slides Cpb
Presenting our Net Margin Gross Margin In Powerpoint And Google Slides Cpb PowerPoint template design. This PowerPoint slide showcases three stages. It is useful to share insightful information on Net Margin Gross Margin. This PPT slide can be easily accessed in standard screen and widescreen aspect ratios. It is also available in various formats like PDF, PNG, and JPG. Not only this, the PowerPoint slideshow is completely editable and you can effortlessly modify the font size, font type, and shapes according to your wish. Our PPT layout is compatible with Google Slides as well, so download and edit it as per your knowledge.
-
 Contribution Margin Gross Margin In Powerpoint And Google Slides Cpb
Presenting Contribution Margin Gross Margin In Powerpoint And Google Slides Cpb slide which is completely adaptable. The graphics in this PowerPoint slide showcase four stages that will help you succinctly convey the information. In addition, you can alternate the color, font size, font type, and shapes of this PPT layout according to your content. This PPT presentation can be accessed with Google Slides and is available in both standard screen and widescreen aspect ratios. It is also a useful set to elucidate topics like Contribution Margin Gross Margin. This well structured design can be downloaded in different formats like PDF, JPG, and PNG. So, without any delay, click on the download button now.
-
 Low Gross Margin In Powerpoint And Google Slides Cpb
Presenting our Low Gross Margin In Powerpoint And Google Slides Cpb PowerPoint template design. This PowerPoint slide showcases four stages. It is useful to share insightful information on Low Gross Margin. This PPT slide can be easily accessed in standard screen and widescreen aspect ratios. It is also available in various formats like PDF, PNG, and JPG. Not only this, the PowerPoint slideshow is completely editable and you can effortlessly modify the font size, font type, and shapes according to your wish. Our PPT layout is compatible with Google Slides as well, so download and edit it as per your knowledge.
-
 Gross Margin Improvement In Powerpoint And Google Slides Cpb
Presenting Gross Margin Improvement In Powerpoint And Google Slides Cpb slide which is completely adaptable. The graphics in this PowerPoint slide showcase seven stages that will help you succinctly convey the information. In addition, you can alternate the color, font size, font type, and shapes of this PPT layout according to your content. This PPT presentation can be accessed with Google Slides and is available in both standard screen and widescreen aspect ratios. It is also a useful set to elucidate topics like Gross Margin Improvement. This well-structured design can be downloaded in different formats like PDF, JPG, and PNG. So, without any delay, click on the download button now.
-
 Gross Margin Calculator In Powerpoint And Google Slides Cpb
Presenting Gross Margin Calculator In Powerpoint And Google Slides Cpb slide which is completely adaptable. The graphics in this PowerPoint slide showcase five stages that will help you succinctly convey the information. In addition, you can alternate the color, font size, font type, and shapes of this PPT layout according to your content. This PPT presentation can be accessed with Google Slides and is available in both standard screen and widescreen aspect ratios. It is also a useful set to elucidate topics like Gross Margin Calculator This well-structured design can be downloaded in different formats like PDF, JPG, and PNG. So, without any delay, click on the download button now.
-
 Gross Margin Target In Powerpoint And Google Slides Cpb
Presenting our Gross Margin Target In Powerpoint And Google Slides Cpb PowerPoint template design. This PowerPoint slide showcases four stages. It is useful to share insightful information on Gross Margin Target This PPT slide can be easily accessed in standard screen and widescreen aspect ratios. It is also available in various formats like PDF, PNG, and JPG. Not only this, the PowerPoint slideshow is completely editable and you can effortlessly modify the font size, font type, and shapes according to your wish. Our PPT layout is compatible with Google Slides as well, so download and edit it as per your knowledge.
-
 Calculating Gross Margin In Powerpoint And Google Slides Cpb
Presenting our Calculating Gross Margin In Powerpoint And Google Slides Cpb PowerPoint template design. This PowerPoint slide showcases four stages. It is useful to share insightful information on Calculating Gross Margin This PPT slide can be easily accessed in standard screen and widescreen aspect ratios. It is also available in various formats like PDF, PNG, and JPG. Not only this, the PowerPoint slideshow is completely editable and you can effortlessly modify the font size, font type, and shapes according to your wish. Our PPT layout is compatible with Google Slides as well, so download and edit it as per your knowledge.
-
 SaaS Gross Margin Benchmark In Powerpoint And Google Slides Cpb
Presenting SaaS Gross Margin Benchmark In Powerpoint And Google Slides Cpb slide which is completely adaptable. The graphics in this PowerPoint slide showcase four stages that will help you succinctly convey the information. In addition, you can alternate the color, font size, font type, and shapes of this PPT layout according to your content. This PPT presentation can be accessed with Google Slides and is available in both standard screen and widescreen aspect ratios. It is also a useful set to elucidate topics like SaaS Gross Margin Benchmark. This well-structured design can be downloaded in different formats like PDF, JPG, and PNG. So, without any delay, click on the download button now.
-
 Gross Margin Ratio In Powerpoint And Google Slides Cpb
Presenting Gross Margin Ratio In Powerpoint And Google Slides Cpb slide which is completely adaptable. The graphics in this PowerPoint slide showcase three stages that will help you succinctly convey the information. In addition, you can alternate the color, font size, font type, and shapes of this PPT layout according to your content. This PPT presentation can be accessed with Google Slides and is available in both standard screen and widescreen aspect ratios. It is also a useful set to elucidate topics like Gross Margin Ratio. This well structured design can be downloaded in different formats like PDF, JPG, and PNG. So, without any delay, click on the download button now.
-
 Saas Gross Margin In Powerpoint And Google Slides Cpb
Presenting Saas Gross Margin In Powerpoint And Google Slides Cpb slide which is completely adaptable. The graphics in this PowerPoint slide showcase four stages that will help you succinctly convey the information. In addition, you can alternate the color, font size, font type, and shapes of this PPT layout according to your content. This PPT presentation can be accessed with Google Slides and is available in both standard screen and widescreen aspect ratios. It is also a useful set to elucidate topics like Saas Gross Margin. This well structured design can be downloaded in different formats like PDF, JPG, and PNG. So, without any delay, click on the download button now.
-
 Retail Gross Margin In Powerpoint And Google Slides Cpb
Presenting our Retail Gross Margin In Powerpoint And Google Slides Cpb PowerPoint template design. This PowerPoint slide showcases four stages. It is useful to share insightful information on Retail Gross Margin. This PPT slide can be easily accessed in standard screen and widescreen aspect ratios. It is also available in various formats like PDF, PNG, and JPG. Not only this, the PowerPoint slideshow is completely editable and you can effortlessly modify the font size, font type, and shapes according to your wish. Our PPT layout is compatible with Google Slides as well, so download and edit it as per your knowledge.
-
 Gross Margin In Powerpoint And Google Slides Cpb
Presenting Gross Margin In Powerpoint And Google Slides Cpb slide which is completely adaptable. The graphics in this PowerPoint slide showcase two stages that will help you succinctly convey the information. In addition, you can alternate the color, font size, font type, and shapes of this PPT layout according to your content. This PPT presentation can be accessed with Google Slides and is available in both standard screen and widescreen aspect ratios. It is also a useful set to elucidate topics like Gross Margin. This well-structured design can be downloaded in different formats like PDF, JPG, and PNG. So, without any delay, click on the download button now.
-
 Gross margin equation accounting ppt powerpoint presentation model graphics cpb
Presenting this set of slides with name Gross Margin Equation Accounting Ppt Powerpoint Presentation Model Graphics Cpb. This is an editable Powerpoint three stages graphic that deals with topics like Gross Margin Equation Accounting to help convey your message better graphically. This product is a premium product available for immediate download and is 100 percent editable in Powerpoint. Download this now and use it in your presentations to impress your audience.
-
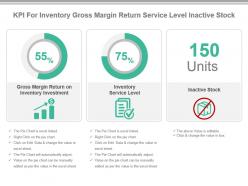 Kpi for inventory gross margin return service level inactive stock presentation slide
Presenting kpi for inventory gross margin return service level inactive stock presentation slide. This presentation slide shows Three Key Performance Indicators or KPIs in a Dashboard style design. The first KPI that can be shown is Gross Margin Return on Inventory Investment. The second KPI is Inventory Service Level. The third is Inactive Stock. These KPI Powerpoint graphics are all data driven, and the shape automatically adjusts according to your data. Just right click on the KPI graphic, enter the right value and the shape will adjust automatically. Make a visual impact with our KPI slides.
-
 Highlights gross margin net income operating expenses
If you require a professional template with great design, then this Highlights Gross Margin Net Income Operating Expenses is an ideal fit for you. Deploy it to enthrall your audience and increase your presentation threshold with the right graphics, images, and structure. Portray your ideas and vision using twelve slides included in this complete deck. This template is suitable for expert discussion meetings presenting your views on the topic. With a variety of slides having the same thematic representation, this template can be regarded as a complete package. It employs some of the best design practices, so everything is well-structured. Not only this, it responds to all your needs and requirements by quickly adapting itself to the changes you make. This PPT slideshow is available for immediate download in PNG, JPG, and PDF formats, further enhancing its usability. Grab it by clicking the download button.
-
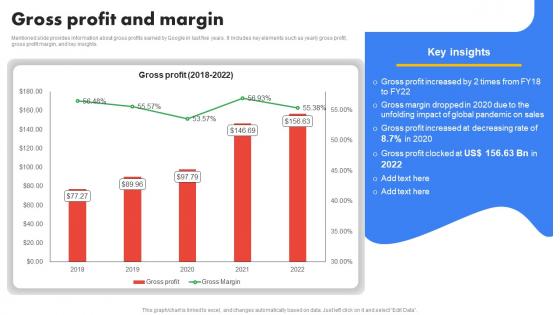 Google Company Profile Gross Profit And Margin CP SS
Mentioned slide provides information about gross profits earned by Google in last five years. It includes key elements such as yearly gross profit, gross profit margin, and key insights. Present the topic in a bit more detail with this Google Company Profile Gross Profit And Margin CP SS. Use it as a tool for discussion and navigation on Profit, Gross, Margin. This template is free to edit as deemed fit for your organization. Therefore download it now.
-
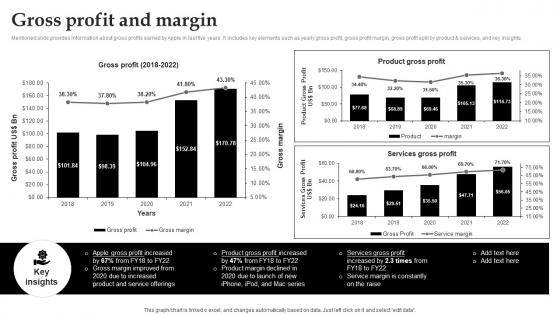 Gross Profit And Margin Apple Company Profile Ppt Pictures CP SS
Mentioned slide provides information about gross profits earned by Apple in last five years. It includes key elements such as yearly gross profit, gross profit margin, gross profit split by product and services, and key insights. Present the topic in a bit more detail with this Gross Profit And Margin Apple Company Profile Ppt Pictures CP SS. Use it as a tool for discussion and navigation on Product Gross Profit. This template is free to edit as deemed fit for your organization. Therefore download it now.
-
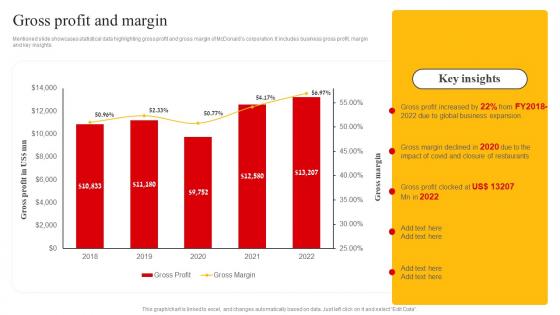 Gross Profit And Margin Mcdonalds Company Profile Ppt Inspiration
Mentioned slide showcases statistical data highlighting gross profit and gross margin of McDonalds corporation. It includes business gross profit, margin and key insights. Deliver an outstanding presentation on the topic using this Gross Profit And Margin Mcdonalds Company Profile Ppt Inspiration. Dispense information and present a thorough explanation of Gross, Increased using the slides given. This template can be altered and personalized to fit your needs. It is also available for immediate download. So grab it now.
-
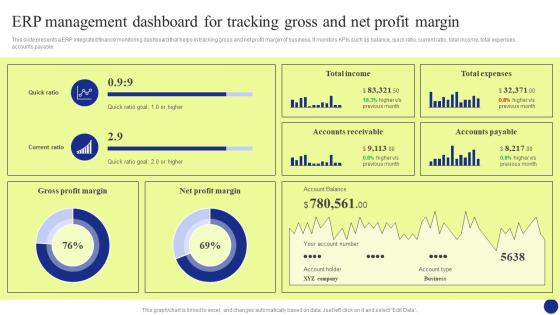 Digital Transformation Erp Management Dashboard For Tracking Gross And Net Profit Margin DT SS
This slide presents a ERP integrated finance monitoring dashboard that helps in tracking gross and net profit margin of business. It monitors KPIs such as balance, quick ratio, current ratio, total income, total expenses, accounts payable. Present the topic in a bit more detail with this Digital Transformation Erp Management Dashboard For Tracking Gross And Net Profit Margin DT SS Use it as a tool for discussion and navigation on Newsletter Campaign, Our Visitors, Sales Overview This template is free to edit as deemed fit for your organization. Therefore download it now.
-
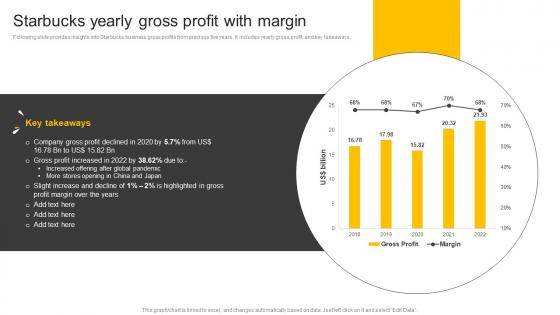 Food And Beverages Starbucks Yearly Gross Profit With Margin CP SS V
Following slide provides insights into Starbucks business gross profits from previous five years. It includes yearly gross profit, and key takeaways. Present the topic in a bit more detail with this Food And Beverages Starbucks Yearly Gross Profit With Margin CP SS V Use it as a tool for discussion and navigation on Gross Profit, Global Pandemic, Profit Margin This template is free to edit as deemed fit for your organization. Therefore download it now.
-
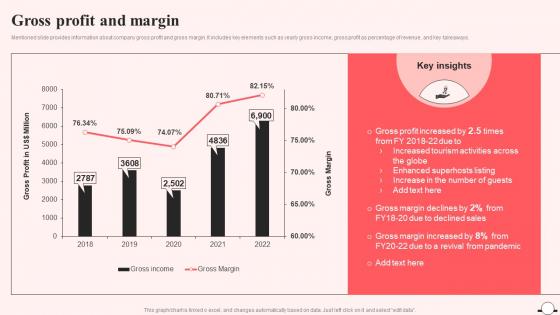 Gross Profit And Margin Airbnb Company Profile Ppt Information CP SS
Mentioned slide provides information about company gross profit and gross margin. It includes key elements such as yearly gross income, gross profit as percentage of revenue, and key takeaways. Deliver an outstanding presentation on the topic using this Gross Profit And Margin Airbnb Company Profile Ppt Information CP SS. Dispense information and present a thorough explanation of Gross Profit And Margin using the slides given. This template can be altered and personalized to fit your needs. It is also available for immediate download. So grab it now.
-
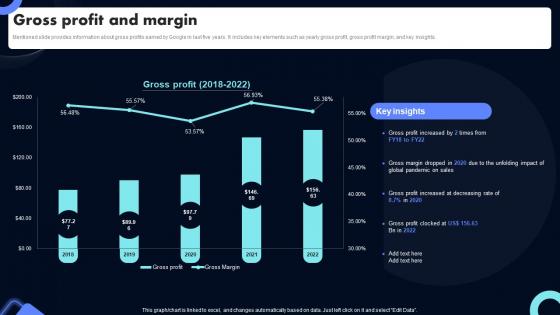 Gross Profit And Margin Search And Advertising Service Company Profile CP SS V
Mentioned slide provides information about gross profits earned by Google in last five years. It includes key elements such as yearly gross profit, gross profit margin, and key insights. Deliver an outstanding presentation on the topic using this Gross Profit And Margin Search And Advertising Service Company Profile CP SS V Dispense information and present a thorough explanation of Gross Profit And Margin using the slides given. This template can be altered and personalized to fit your needs. It is also available for immediate download. So grab it now.
-
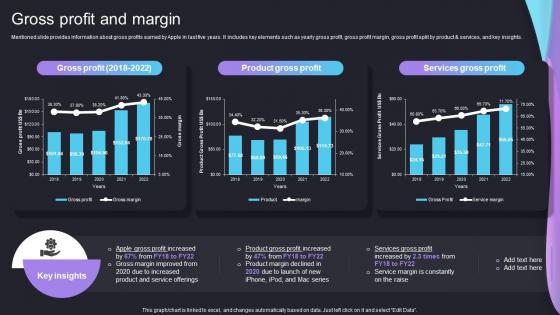 Gross Profit And Margin Iphone Company Profile Ppt Styles Display CP SS V
Mentioned slide provides information about gross profits earned by Apple in last five years. It includes key elements such as yearly gross profit, gross profit margin, gross profit split by product and services, and key insights. Deliver an outstanding presentation on the topic using this Gross Profit And Margin Iphone Company Profile Ppt Styles Display CP SS V Dispense information and present a thorough explanation of Product And Service, Product Margin, Service Margin using the slides given. This template can be altered and personalized to fit your needs. It is also available for immediate download. So grab it now.
-
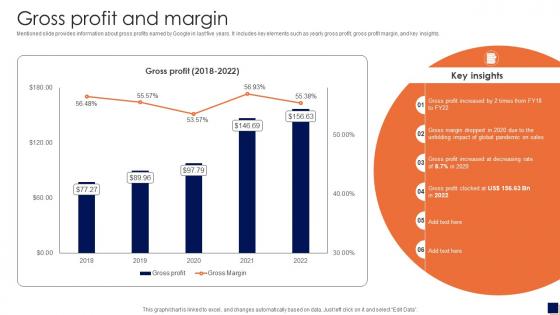 Gross Profit And Margin Smart Electronics Manufacturing Company Profile CP SS V
Mentioned slide provides information about gross profits earned by Google in last five years. It includes key elements such as yearly gross profit, gross profit margin, and key insights. Deliver an outstanding presentation on the topic using this Gross Profit And Margin Smart Electronics Manufacturing Company Profile CP SS V. Dispense information and present a thorough explanation of Gross Profit, Gross Margin using the slides given. This template can be altered and personalized to fit your needs. It is also available for immediate download. So grab it now.
-
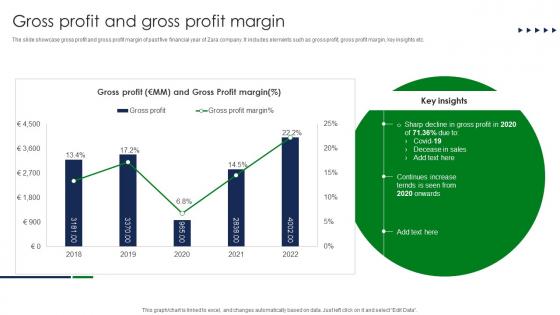 Gross Profit And Gross Profit Margin Luxury Clothing Business Profile CP SS V
The slide showcase gross profit and gross profit margin of past five financial year of Zara company. It includes elements such as gross profit, gross profit margin, key insights etc. Deliver an outstanding presentation on the topic using this Gross Profit And Gross Profit Margin Luxury Clothing Business Profile CP SS V Dispense information and present a thorough explanation of Gross Profit, Gross Profit Margin using the slides given. This template can be altered and personalized to fit your needs. It is also available for immediate download. So grab it now.
-
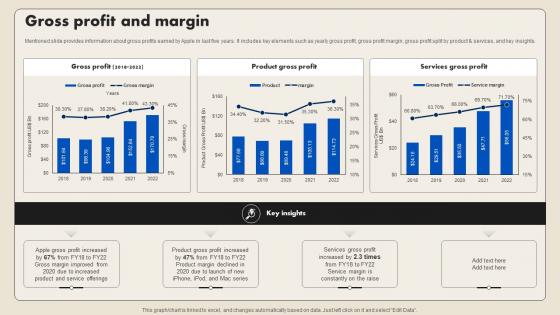 Gross Profit And Margin Smartphone Company Profile CP SS V
Mentioned slide provides information about gross profits earned by Apple in last five years. It includes key elements such as yearly gross profit, gross profit margin, gross profit split by product and services, and key insights. Present the topic in a bit more detail with this Gross Profit And Margin Smartphone Company Profile CP SS V Use it as a tool for discussion and navigation on Gross Profit And Margin This template is free to edit as deemed fit for your organization. Therefore download it now.
-
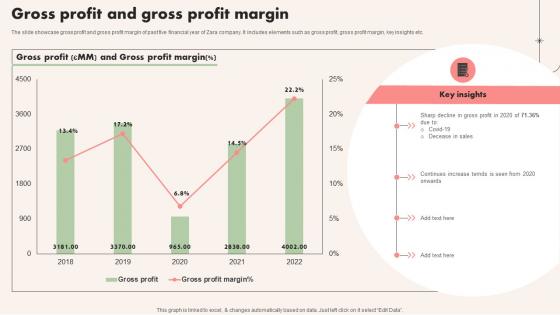 Gross Profit And Gross Profit Margin Apparel Company Profile CP SS V
The slide showcase gross profit and gross profit margin of past five financial year of Zara company. It includes elements such as gross profit, gross profit margin, key insights etc. Deliver an outstanding presentation on the topic using this Gross Profit And Gross Profit Margin Apparel Company Profile CP SS V Dispense information and present a thorough explanation of Gross Profit, Gross Profit Margin using the slides given. This template can be altered and personalized to fit your needs. It is also available for immediate download. So grab it now.
-
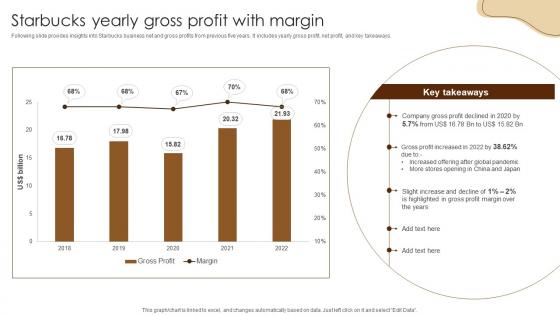 Starbucks Yearly Gross Profit With Margin Coffee Business Company Profile CP SS V
Following slide provides insights into Starbucks business net and gross profits from previous five years. It includes yearly gross profit, net profit, and key takeaways. Present the topic in a bit more detail with this Starbucks Yearly Gross Profit With Margin Coffee Business Company Profile CP SS V. Use it as a tool for discussion and navigation on Company, Profit, Increased. This template is free to edit as deemed fit for your organization. Therefore download it now.
-
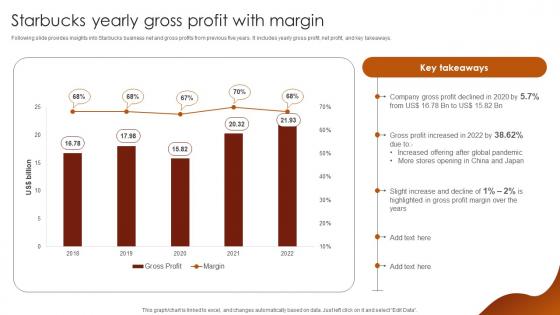 Starbucks Yearly Gross Profit With Margin Luxury Coffee Brand Company Profile CP SS V
Following slide provides insights into Starbucks business net and gross profits from previous five years. It includes yearly gross profit, net profit, and key takeaways. Present the topic in a bit more detail with this Starbucks Yearly Gross Profit With Margin Luxury Coffee Brand Company Profile CP SS V. Use it as a tool for discussion and navigation on Starbucks Yearly, Gross Profit With Margin. This template is free to edit as deemed fit for your organization. Therefore download it now.
-
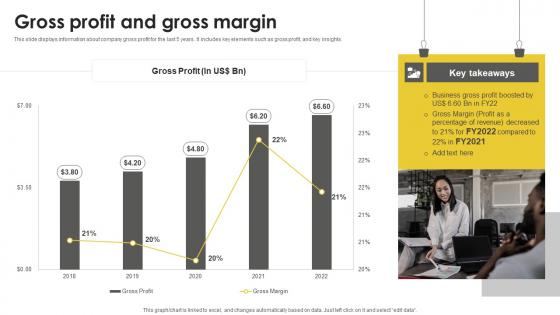 Gross Profit And Gross Margin Real Estate Company Profile CP SS
This slide displays information about company gross profit for the last 5 years. It includes key elements such as gross profit, and key insights. Present the topic in a bit more detail with this Gross Profit And Gross Margin Real Estate Company Profile CP SS. Use it as a tool for discussion and navigation on Gross, Profit, Gross. This template is free to edit as deemed fit for your organization. Therefore download it now.
-
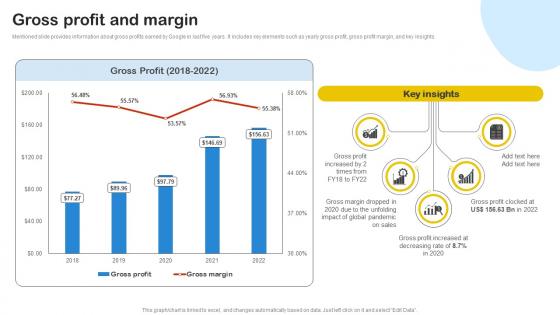 Gross Profit And Margin Digital Advertising And Promotion Company Profile CP SS V
Mentioned slide provides information about gross profits earned by Google in last five years. It includes key elements such as yearly gross profit, gross profit margin, and key insights. Present the topic in a bit more detail with this Gross Profit And Margin Digital Advertising And Promotion Company Profile CP SS V. Use it as a tool for discussion and navigation on Profit, Margin, Gross. This template is free to edit as deemed fit for your organization. Therefore download it now.
-
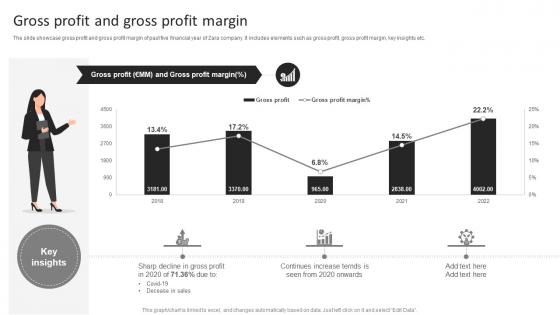 Zara Company Profile Gross Profit And Gross Profit Margin Ppt Information CP SS
The slide showcase gross profit and gross profit margin of past five financial year of Zara company. It includes elements such as gross profit, gross profit margin, key insights etc. Present the topic in a bit more detail with this Zara Company Profile Gross Profit And Gross Profit Margin Ppt Information CP SS. Use it as a tool for discussion and navigation on Gross Profit, Gross Profit Margin. This template is free to edit as deemed fit for your organization. Therefore download it now.
-
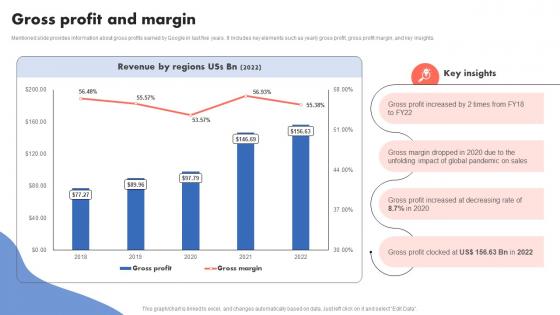 Gross Profit And Margin Search Engine Technology Company Profile CP SS V
Mentioned slide provides information about gross profits earned by Google in last five years. It includes key elements such as yearly gross profit, gross profit margin, and key insights. Present the topic in a bit more detail with this Gross Profit And Margin Search Engine Technology Company Profile CP SS V. Use it as a tool for discussion and navigation on Increased, Margin, Decreasing. This template is free to edit as deemed fit for your organization. Therefore download it now.
-
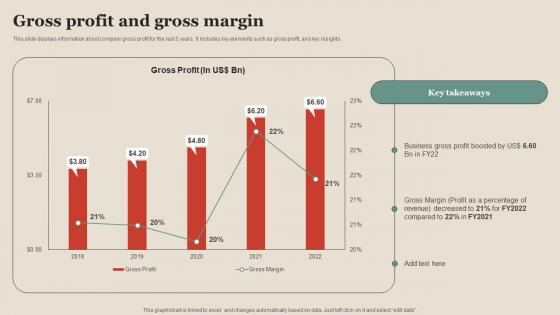 Gross Profit And Gross Margin Property Company Profile CP SS V
This slide displays information about company gross profit for the last 5 years. It includes key elements such as gross profit, and key insights. Deliver an outstanding presentation on the topic using this Gross Profit And Gross Margin Property Company Profile CP SS V Dispense information and present a thorough explanation of Gross Profit And Gross Margin using the slides given. This template can be altered and personalized to fit your needs. It is also available for immediate download. So grab it now.
-
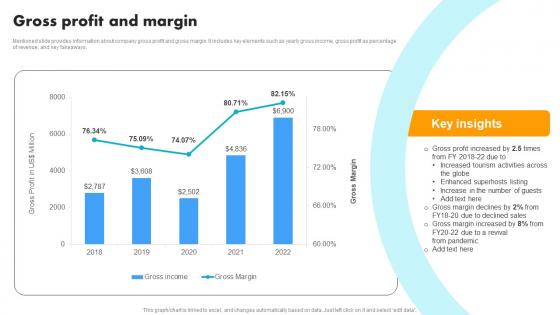 Gross Profit And Margin Vacation Rental Solution Company Profile CP SS V
Mentioned slide provides information about company gross profit and gross margin. It includes key elements such as yearly gross income, gross profit as percentage of revenue, and key takeaways. Deliver an outstanding presentation on the topic using this Gross Profit And Margin Vacation Rental Solution Company Profile CP SS V Dispense information and present a thorough explanation of Gross Profit, Margin, Revival From Pandemic using the slides given. This template can be altered and personalized to fit your needs. It is also available for immediate download. So grab it now.
-
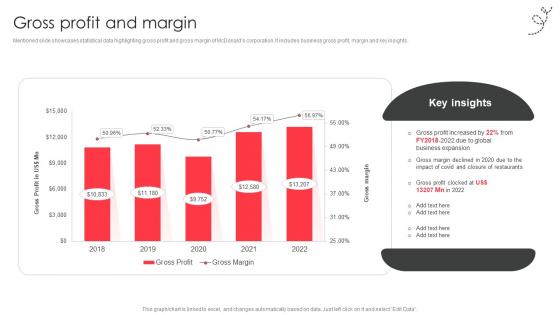 Gross profit and margin fast food company profile CP SS V
Mentioned slide showcases statistical data highlighting gross profit and gross margin of McDonalds corporation. It includes business gross profit, margin and key insights. Deliver an outstanding presentation on the topic using this Gross profit and margin fast food company profile CP SS V Dispense information and present a thorough explanation of Gross Profit And Margin using the slides given. This template can be altered and personalized to fit your needs. It is also available for immediate download. So grab it now.
-
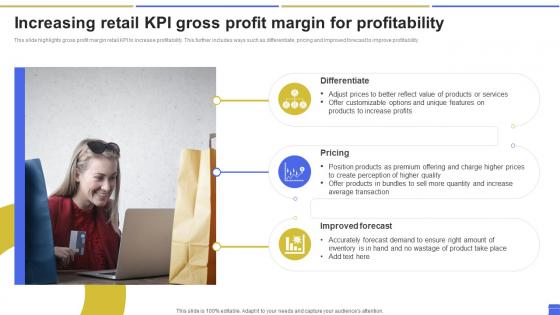 Increasing Retail KPI Gross Profit Margin For Profitability
This slide highlights gross profit margin retail KPI to increase profitability. This further includes ways such as differentiate, pricing and improved forecast to improve profitability. Introducing our premium set of slides with Increasing Retail KPI Gross Profit Margin For Profitability. Ellicudate the three stages and present information using this PPT slide. This is a completely adaptable PowerPoint template design that can be used to interpret topics like Differentiate, Pricing. So download instantly and tailor it with your information.
-
 Retail Markup Percentage Gross Margin In Powerpoint And Google Slides Cpb
Presenting Retail Markup Percentage Gross Margin In Powerpoint And Google Slides Cpb slide which is completely adaptable. The graphics in this PowerPoint slide showcase four stages that will help you succinctly convey the information. In addition, you can alternate the color, font size, font type, and shapes of this PPT layout according to your content. This PPT presentation can be accessed with Google Slides and is available in both standard screen and widescreen aspect ratios. It is also a useful set to elucidate topics like Retail Markup Percentage Gross Margin. This well structured design can be downloaded in different formats like PDF, JPG, and PNG. So, without any delay, click on the download button now.
-
 Good Gross Margin Ratio In Powerpoint And Google Slides Cpb
Presenting Good Gross Margin Ratio In Powerpoint And Google Slides Cpb slide which is completely adaptable. The graphics in this PowerPoint slide showcase Four stages that will help you succinctly convey the information. In addition, you can alternate the color, font size, font type, and shapes of this PPT layout according to your content. This PPT presentation can be accessed with Google Slides and is available in both standard screen and widescreen aspect ratios. It is also a useful set to elucidate topics like Good Gross Margin Ratio. This well-structured design can be downloaded in different formats like PDF, JPG, and PNG. So, without any delay, click on the download button now.
-
 Gross Margin Percentage In Powerpoint And Google Slides Cpb
Presenting our Gross Margin Percentage In Powerpoint And Google Slides Cpb PowerPoint template design. This PowerPoint slide showcases five stages. It is useful to share insightful information on Gross Margin Percentage. This PPT slide can be easily accessed in standard screen and widescreen aspect ratios. It is also available in various formats like PDF, PNG, and JPG. Not only this, the PowerPoint slideshow is completely editable and you can effortlessly modify the font size, font type, and shapes according to your wish. Our PPT layout is compatible with Google Slides as well, so download and edit it as per your knowledge.
-
 Retail Gross Margin In Powerpoint And Google Slides Cpb
Presenting our Retail Gross Margin In Powerpoint And Google Slides Cpb PowerPoint template design. This PowerPoint slide showcases four stages. It is useful to share insightful information on Retail Gross Margin. This PPT slide can be easily accessed in standard screen and widescreen aspect ratios. It is also available in various formats like PDF, PNG, and JPG. Not only this, the PowerPoint slideshow is completely editable and you can effortlessly modify the font size, font type, and shapes according to your wish. Our PPT layout is compatible with Google Slides as well, so download and edit it as per your knowledge.
-
 Gross Margin In Powerpoint And Google Slides Cpb
Presenting Gross Margin In Powerpoint And Google Slides Cpb slide which is completely adaptable. The graphics in this PowerPoint slide showcase two stages that will help you succinctly convey the information. In addition, you can alternate the color, font size, font type, and shapes of this PPT layout according to your content. This PPT presentation can be accessed with Google Slides and is available in both standard screen and widescreen aspect ratios. It is also a useful set to elucidate topics like Gross Margin. This well-structured design can be downloaded in different formats like PDF, JPG, and PNG. So, without any delay, click on the download button now.
-
 Gross Profit Margins Industry In Powerpoint And Google Slides Cpb
Presenting Gross Profit Margins Industry In Powerpoint And Google Slides Cpb slide which is completely adaptable. The graphics in this PowerPoint slide showcase four stages that will help you succinctly convey the information. In addition, you can alternate the color, font size, font type, and shapes of this PPT layout according to your content. This PPT presentation can be accessed with Google Slides and is available in both standard screen and widescreen aspect ratios. It is also a useful set to elucidate topics like Gross Profit Margins Industry. This well-structured design can be downloaded in different formats like PDF, JPG, and PNG. So, without any delay, click on the download button now.
-
 Gross Margin Ratio Example In Powerpoint And Google Slides Cpb
Presenting Gross Margin Ratio Example In Powerpoint And Google Slides Cpb slide which is completely adaptable. The graphics in this PowerPoint slide showcase four stages that will help you succinctly convey the information. In addition, you can alternate the color, font size, font type, and shapes of this PPT layout according to your content. This PPT presentation can be accessed with Google Slides and is available in both standard screen and widescreen aspect ratios. It is also a useful set to elucidate topics like Gross Margin Ratio Example. This well-structured design can be downloaded in different formats like PDF, JPG, and PNG. So, without any delay, click on the download button now.
-
 Gross Profit Margin Measure Profit Margin In Powerpoint And Google Slides Cpb
Presenting our Gross Profit Margin Measure Profit Margin In Powerpoint And Google Slides Cpb PowerPoint template design. This PowerPoint slide showcases four stages. It is useful to share insightful information on Gross Profit Margin Measure Profit Margin This PPT slide can be easily accessed in standard screen and widescreen aspect ratios. It is also available in various formats like PDF, PNG, and JPG. Not only this, the PowerPoint slideshow is completely editable and you can effortlessly modify the font size, font type, and shapes according to your wish. Our PPT layout is compatible with Google Slides as well, so download and edit it as per your knowledge.
-
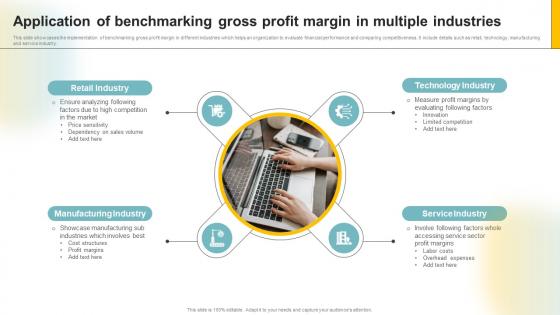 Application Of Benchmarking Gross Profit Margin In Multiple Industries
This slide showcases the implementation of benchmarking gross profit margin in different industries which helps an organization to evaluate financial performance and comparing competitiveness. It include details such as retail, technology, manufacturing and service industry. Presenting our set of slides with Application Of Benchmarking Gross Profit Margin In Multiple Industries. This exhibits information on four stages of the process. This is an easy to edit and innovatively designed PowerPoint template. So download immediately and highlight information on Retail Industry, Technology Industry, Manufacturing Industry, Service Industry.
-
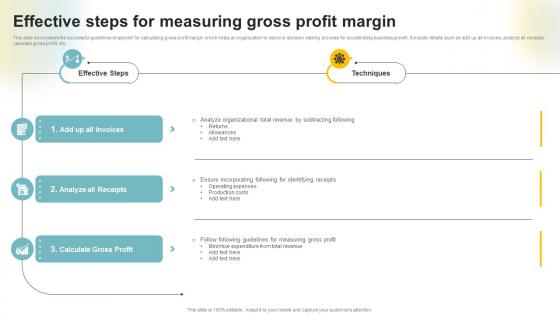 Effective Steps For Measuring Gross Profit Margin
This slide showcases the successful guidelines employed for calculating gross profit margin which helps an organization to improve decision making process for accelerating business growth. It include details such as add up all invoices, analyze all receipts, calculate gross profit, etc. Presenting our set of slides with Effective Steps For Measuring Gross Profit Margin. This exhibits information on three stages of the process. This is an easy to edit and innovatively designed PowerPoint template. So download immediately and highlight information on Effective Steps, Techniques, Analyze.
-
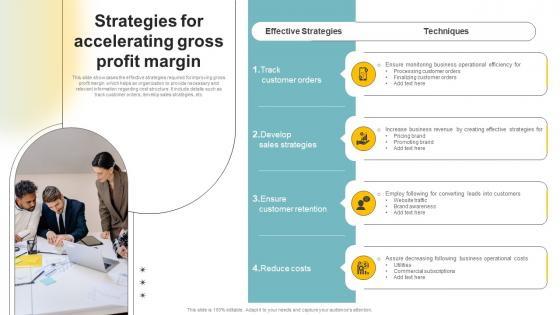 Strategies For Accelerating Gross Profit Margin
This slide showcases the effective strategies required for improving gross profit margin which helps an organization to provide necessary and relevant information regarding cost structure. It include details such as track customer orders, develop sales strategies, etc. Presenting our set of slides with Strategies For Accelerating Gross Profit Margin. This exhibits information on four stages of the process. This is an easy to edit and innovatively designed PowerPoint template. So download immediately and highlight information on Effective Strategies, Techniques, Pricing Brand.
-
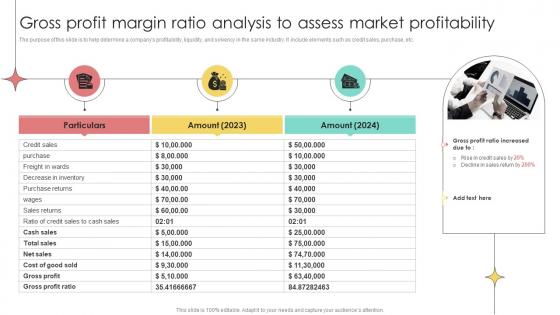 Gross Profit Margin Ratio Analysis To Assess Market Profitability
The purpose of this slide is to help determine a companys profitability, liquidity, and solvency in the same industry. It include elements such as credit sales, purchase, etc. Introducing our Gross Profit Margin Ratio Analysis To Assess Market Profitability set of slides. The topics discussed in these slides are Decrease In Inventory, Credit Sales To Cash Sales, Gross Profit. This is an immediately available PowerPoint presentation that can be conveniently customized. Download it and convince your audience.
-
 Customer segments gross margin ppt sample download
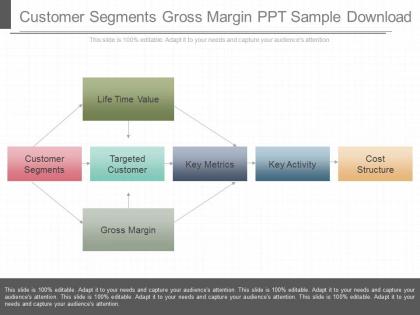
Presenting customer segments gross margin ppt sample download. This is a customer segments gross margin ppt sample download. This is a one stage process. The stages in this process are life time value, customer segments, targete customer, key metrics, key activity, cost structure, gross margin.
-
 Convenient Food Company Profile Gross Profit And Margin Ppt Slides Master Slide
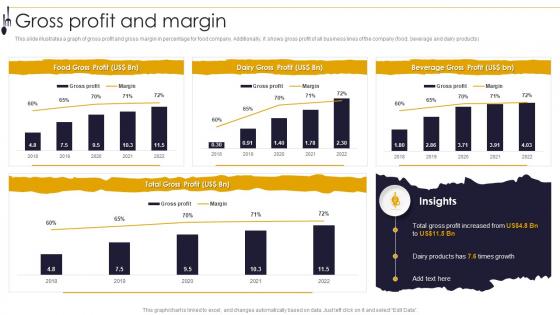
This slide illustrates a graph of gross profit and gross margin in percentage for food company. Additionally, it shows gross profit of all business lines of the company food, beverage and dairy products. Deliver an outstanding presentation on the topic using this Convenient Food Company Profile Gross Profit And Margin Ppt Slides Master Slide. Dispense information and present a thorough explanation of Dairy Gross Profit, Food Gross Profit, Beverage Gross Profit, Total Gross Profit using the slides given. This template can be altered and personalized to fit your needs. It is also available for immediate download. So grab it now.
-
 Finance KPI Dashboard Illustrating Gross And Operating Profit Margin
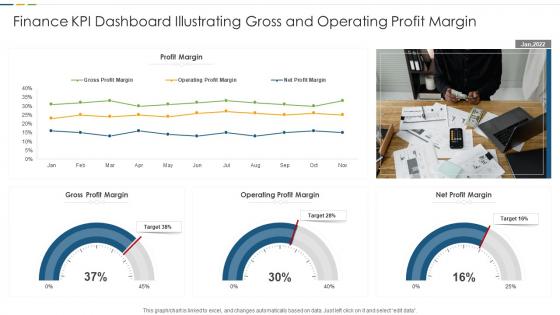
Introducing our Finance KPI Dashboard Illustrating Gross And Operating Profit Margin set of slides. The topics discussed in these slides are Gross Profit Margin, Operating Profit Margin, Net Profit Margin. This is an immediately available PowerPoint presentation that can be conveniently customized. Download it and convince your audience.
-
 Projected Gross Margin Monthly Strategies Startups Need Support Growth Business
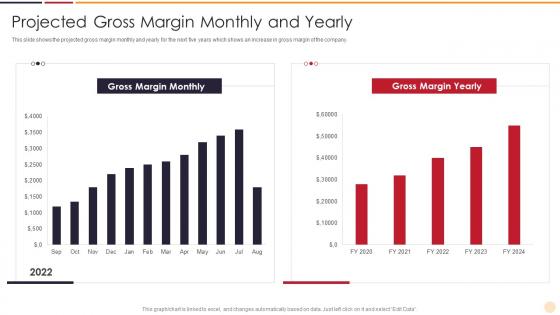
This slide shows the projected gross margin monthly and yearly for the next five years which shows an increase in gross margin of the company. Present the topic in a bit more detail with this Projected Gross Margin Monthly Strategies Startups Need Support Growth Business. Use it as a tool for discussion and navigation on Projected Gross Margin Monthly And Yearly. This template is free to edit as deemed fit for your organization. Therefore download it now.
-
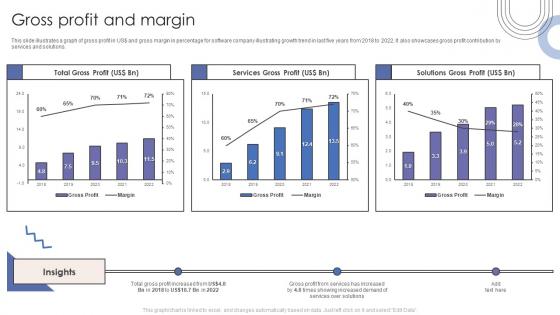 Gross Profit And Margin Software Products And Services Company Profile
This slide illustrates a graph of gross profit in US dollar and gross margin in percentage for software company illustrating growth trend in last five years from 2018 to 2022. It also showcases gross profit contribution by services and solutions. Present the topic in a bit more detail with this Gross Profit And Margin Software Products And Services Company Profile. Use it as a tool for discussion and navigation on Gross Profit And Margin, Services, Solutions. This template is free to edit as deemed fit for your organization. Therefore download it now.
-
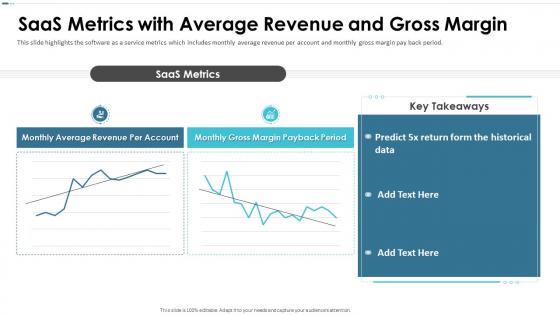 Canvas Investor Funding Elevator Pitch Deck Saas Metrics With Average Revenue And Gross Margin
This slide highlights the software as a service metrics which includes monthly average revenue per account and monthly gross margin pay back period. Present the topic in a bit more detail with this Canvas Investor Funding Elevator Pitch Deck Saas Metrics With Average Revenue And Gross Margin. Use it as a tool for discussion and navigation on Saas Metrics With Average Revenue And Gross Margin . This template is free to edit as deemed fit for your organization. Therefore download it now.
-
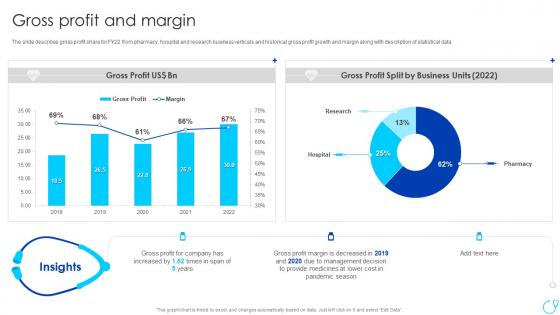 Gross Profit And Margin Healthcare Company Profile Ppt Introduction
The slide describes gross profit share for FY22 from pharmacy, hospital and research business verticals and historical gross profit growth and margin along with description of statistical data Deliver an outstanding presentation on the topic using this Gross Profit And Margin Healthcare Company Profile Ppt Introduction. Dispense information and present a thorough explanation of Business, Management, Statistical using the slides given. This template can be altered and personalized to fit your needs. It is also available for immediate download. So grab it now.
-
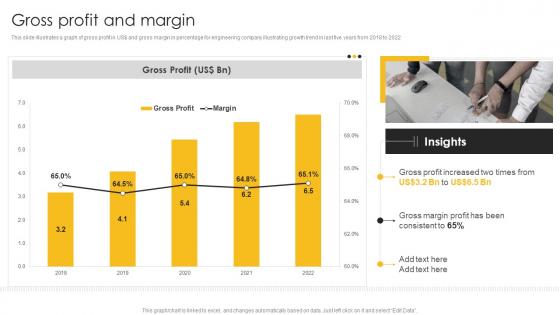 Engineering Company Profile Gross Profit And Margin
This slide illustrates a graph of gross profit in US dollar and gross margin in percentage for engineering company illustrating growth trend in last five years from 2018 to 2022 Present the topic in a bit more detail with this Engineering Company Profile Gross Profit And Margin. Use it as a tool for discussion and navigation on Gross Profit And Margin. This template is free to edit as deemed fit for your organization. Therefore download it now.
-
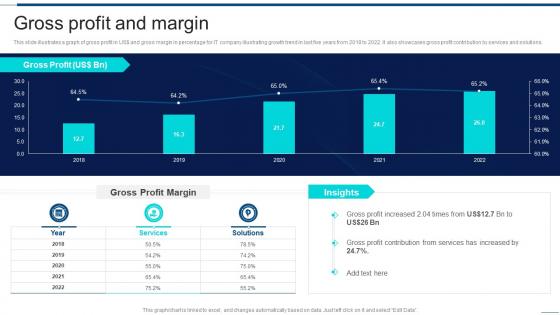 Gross Profit And Margin Information Technology Company Profile Ppt Graphics
This slide illustrates a graph of gross profit in US dollar and gross margin in percentage for IT company illustrating growth trend in last five years from 2018 to 2022. It also showcases gross profit contribution by services and solutions. Present the topic in a bit more detail with this Gross Profit And Margin Information Technology Company Profile Ppt Graphics. Use it as a tool for discussion and navigation on Gross Profit Margin, Gross Profit Contribution, Services. This template is free to edit as deemed fit for your organization. Therefore download it now.
-
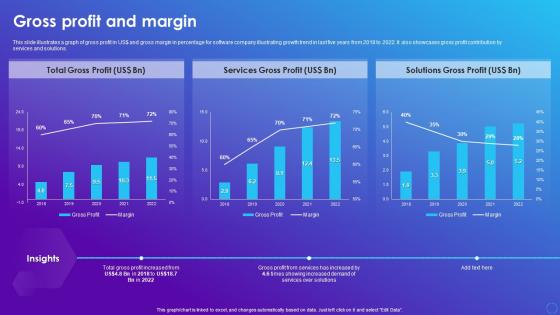 Gross Profit And Margin Software Company Profile Ppt Ideas
This slide illustrates a graph of gross profit in US dollar and gross margin in percentage for software company illustrating growth trend in last five years from 2018 to 2022. It also showcases gross profit contribution by services and solutions. Deliver an outstanding presentation on the topic using this Gross Profit And Margin Software Company Profile Ppt Ideas. Dispense information and present a thorough explanation of Total Gross Profit, Services Gross Profit, Solutions Gross Profit using the slides given. This template can be altered and personalized to fit your needs. It is also available for immediate download. So grab it now.
-
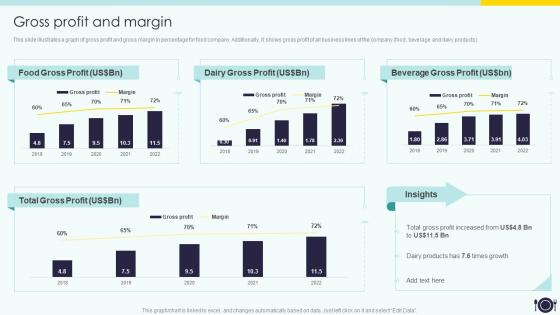 Gross Profit And Margin Canned Food Company Profile Ppt Powerpoint Presentation Icon Layouts
This slide illustrates a graph of gross profit and gross margin in percentage for food company. Additionally, it shows gross profit of all business lines of the company food, beverage and dairy products.Present the topic in a bit more detail with this Gross Profit And Margin Canned Food Company Profile Ppt Powerpoint Presentation Icon Layouts Use it as a tool for discussion and navigation on Dairy Gross, Beverage Gross, Profit Increased This template is free to edit as deemed fit for your organization. Therefore download it now.
-
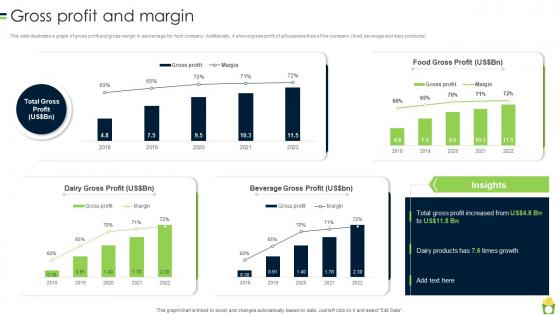 Gross Profit And Margin Processed Food Company Profile Ppt Template
This slide illustrates a graph of gross profit and gross margin in percentage for food company. Additionally, it shows gross profit of all business lines of the company food, beverage and dairy products. Present the topic in a bit more detail with this Gross Profit And Margin Processed Food Company Profile Ppt Template. Use it as a tool for discussion and navigation on Gross Profit, Beverage Gross Profit. This template is free to edit as deemed fit for your organization. Therefore download it now.
-
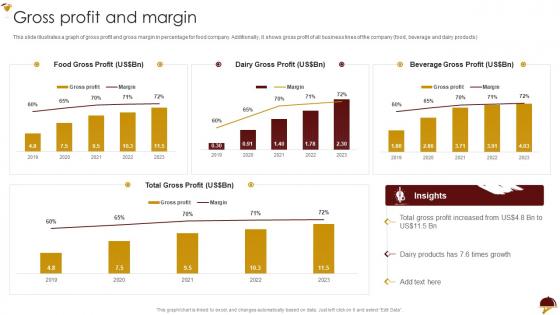 Food Company Profile Gross Profit And Margin Ppt Powerpoint Presentation Professional Slide
This slide illustrates a graph of gross profit and gross margin in percentage for food company. Additionally, it shows gross profit of all business lines of the company food, beverage and dairy products. Present the topic in a bit more detail with this Food Company Profile Gross Profit And Margin Ppt Powerpoint Presentation Professional Slide. Use it as a tool for discussion and navigation on Food Gross Profit, Dairy Gross Profit, Beverage Gross Profit. This template is free to edit as deemed fit for your organization. Therefore download it now.
-
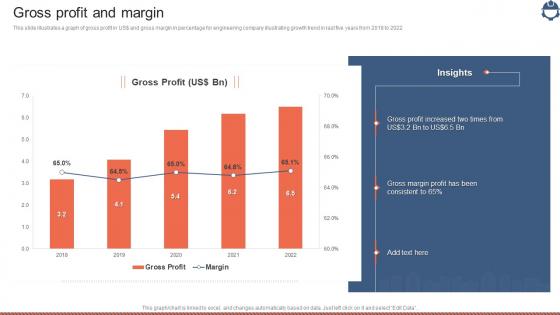 Gross Profit And Margin Engineering Services And Consultancy Company Profile Ppt File Example File
This slide illustrates a graph of gross profit in US dollar and gross margin in percentage for engineering company illustrating growth trend in last five years from 2018 to 2022 Deliver an outstanding presentation on the topic using this Gross Profit And Margin Engineering Services And Consultancy Company Profile Ppt File Example File. Dispense information and present a thorough explanation of Illustrating, Percentage, Consistent using the slides given. This template can be altered and personalized to fit your needs. It is also available for immediate download. So grab it now.
-
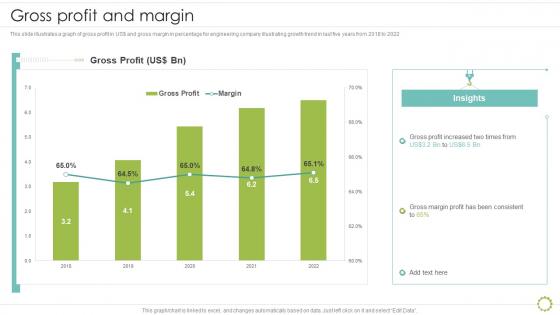 Gross Profit And Margin Construction And Manufacturing Engineering Company Profile Ppt Topics
This slide illustrates a graph of gross profit in US dollar and gross margin in percentage for engineering company illustrating growth trend in last five years from 2018 to 2022 Deliver an outstanding presentation on the topic using this Gross Profit And Margin Construction And Manufacturing Engineering Company Profile Ppt Topics. Dispense information and present a thorough explanation of Gross Profit, Illustrates, Gross Margin using the slides given. This template can be altered and personalized to fit your needs. It is also available for immediate download. So grab it now.
-
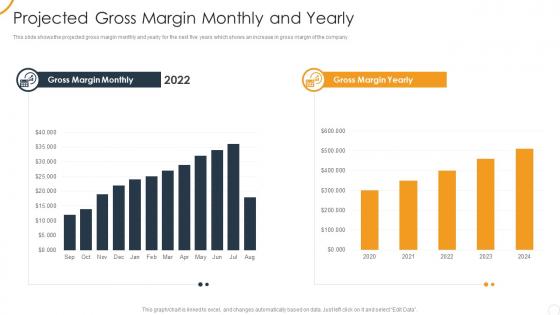 Ultimate organizational strategy for incredible gross margin monthly and yearly
This slide shows the projected gross margin monthly and yearly for the next five years which shows an increase in gross margin of the company. Present the topic in a bit more detail with this Ultimate Organizational Strategy For Incredible Gross Margin Monthly And Yearly. Use it as a tool for discussion and navigation on Projected Gross Margin Monthly And Yearly. This template is free to edit as deemed fit for your organization. Therefore download it now.
-
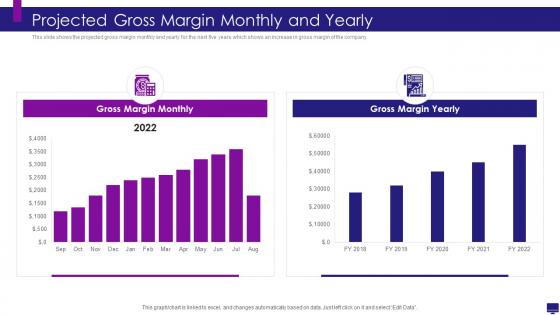 Develop good company strategy for financial growth gross margin monthly and yearly
This slide shows the projected gross margin monthly and yearly for the next five years which shows an increase in gross margin of the company. Deliver an outstanding presentation on the topic using this Develop Good Company Strategy For Financial Growth Gross Margin Monthly And Yearly. Dispense information and present a thorough explanation of Projected Gross Margin Monthly And Yearly using the slides given. This template can be altered and personalized to fit your needs. It is also available for immediate download. So grab it now.
-
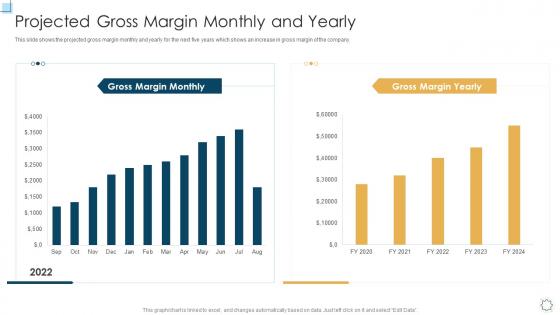 Strategic planning for startup gross margin monthly and yearly
This slide shows the projected gross margin monthly and yearly for the next five years which shows an increase in gross margin of the company. Present the topic in a bit more detail with this Strategic Planning For Startup Gross Margin Monthly And Yearly. Use it as a tool for discussion and navigation on Projected Gross Margin Monthly And Yearly. This template is free to edit as deemed fit for your organization. Therefore download it now.
-
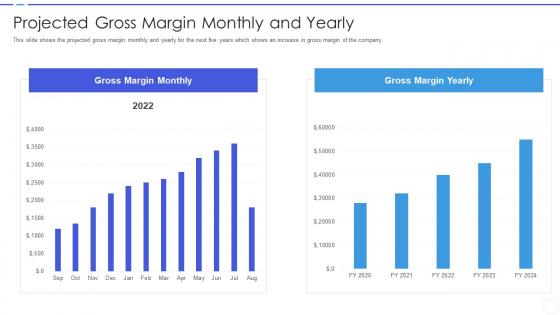 Business development strategy for startups projected gross margin monthly and yearly
This slide shows the projected gross margin monthly and yearly for the next five years which shows an increase in gross margin of the company. Deliver an outstanding presentation on the topic using this Business Development Strategy For Startups Projected Gross Margin Monthly And Yearly. Dispense information and present a thorough explanation of Gross Margin Yearly, Gross Margin Monthly, 2020 To 2024 using the slides given. This template can be altered and personalized to fit your needs. It is also available for immediate download. So grab it now.
-
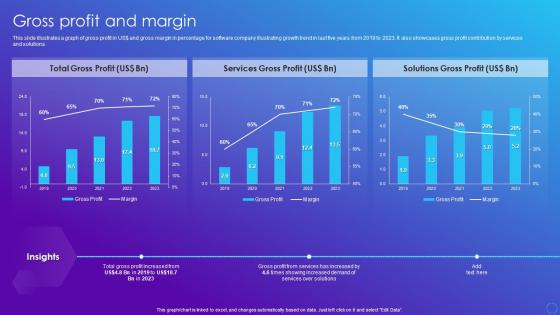 Gross Profit And Margin Software Company Financial Summary Report Ppt Diagrams
This slide illustrates a graph of gross profit in US doller and gross margin in percentage for software company illustrating growth trend in last five years from 2019 to 2023. It also showcases gross profit contribution by services and solutions. Deliver an outstanding presentation on the topic using this Gross Profit And Margin Software Company Financial Summary Report Ppt Diagrams. Dispense information and present a thorough explanation of Total Gross Profit, Services Gross Profit, Solutions Gross Profit using the slides given. This template can be altered and personalized to fit your needs. It is also available for immediate download. So grab it now.
-
 Gross Profit And Margin Information Technology Company Financial Report
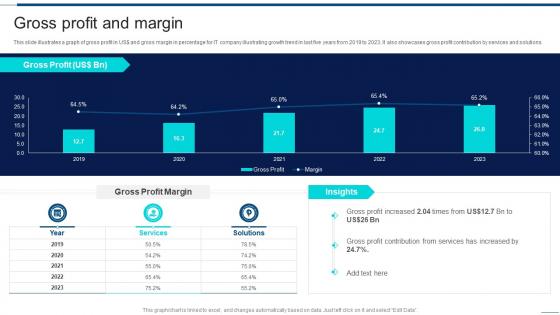
This slide illustrates a graph of gross profit in US dollar and gross margin in percentage for IT company illustrating growth trend in last five years from 2019 to 2023. It also showcases gross profit contribution by services and solutions. Deliver an outstanding presentation on the topic using this Gross Profit And Margin Information Technology Company Financial Report. Dispense information and present a thorough explanation of Contribution, Services, Solutions using the slides given. This template can be altered and personalized to fit your needs. It is also available for immediate download. So grab it now.
-
 Yearly Trend Dashboard With Revenue And Gross Margin
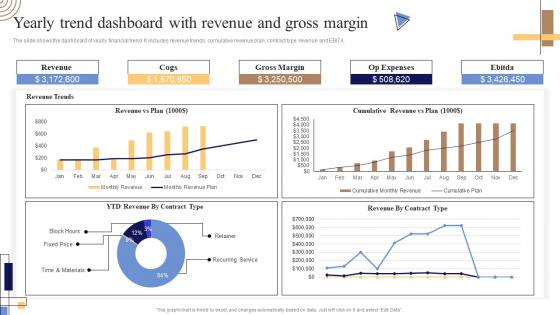
The slide shows the dashboard of yearly financial trend. It includes revenue trends, cumulative revenue plan, contract type revenue and EBITA. Introducing our Yearly Trend Dashboard With Revenue And Gross Margin set of slides. The topics discussed in these slides are Revenue, Cogs, Gross Margin, Op Expenses. This is an immediately available PowerPoint presentation that can be conveniently customized. Download it and convince your audience.
-
 Gross Profit And Margin Healthcare Company Financial Report
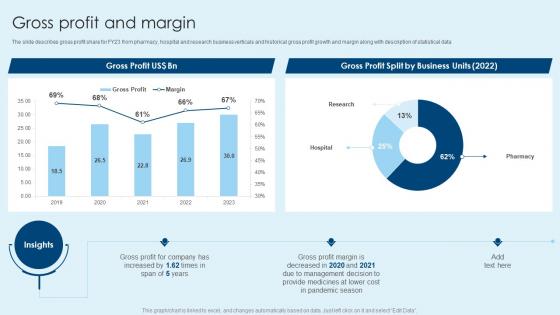
The slide describes gross profit share for FY23 from pharmacy, hospital and research business verticals and historical gross profit growth and margin along with description of statistical data.Present the topic in a bit more detail with this Gross Profit And Margin Healthcare Company Financial Report. Use it as a tool for discussion and navigation on Gross Profit, Business Units, Management Decision. This template is free to edit as deemed fit for your organization. Therefore download it now.
-
 Medical Services Company Profile Gross Profit And Margin
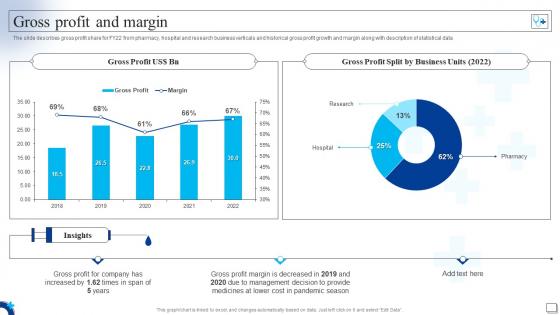
The slide describes gross profit share for FY22 from pharmacy, hospital and research business verticals and historical gross profit growth and margin along with description of statistical data Present the topic in a bit more detail with this Medical Services Company Profile Gross Profit And Margin. Use it as a tool for discussion and navigation on Research, Business, Statistical. This template is free to edit as deemed fit for your organization. Therefore download it now.
-
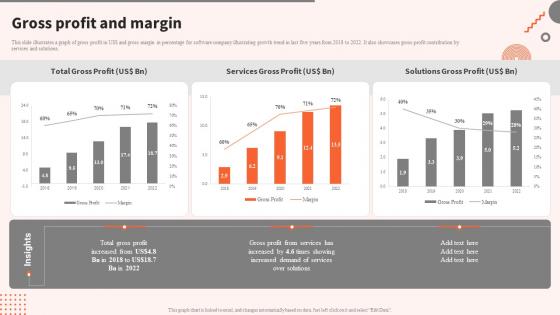 Gross Profit And Margin Digital Software Tools Company Profile Ppt File Graphics Download
This slide illustrates a graph of gross profit in US dollar and gross margin in percentage for software company illustrating growth trend in last five years from 2018 to 2022. It also showcases gross profit contribution by services and solutions. Present the topic in a bit more detail with this Gross Profit And Margin Digital Software Tools Company Profile Ppt File Graphics Download. Use it as a tool for discussion and navigation on Solutions, Illustrating, Growth. This template is free to edit as deemed fit for your organization. Therefore download it now


