Gross Profit And Margin Software Company Financial Summary Report Ppt Diagrams
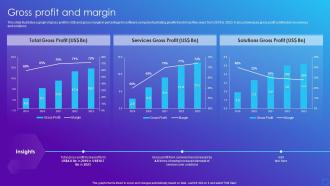
This slide illustrates a graph of gross profit in US doller and gross margin in percentage for software company illustrating growth trend in last five years from 2019 to 2023. It also showcases gross profit contribution by services and solutions.
You must be logged in to download this presentation.
 Impress your
 audience
Editable
of Time
PowerPoint presentation slides
This slide illustrates a graph of gross profit in US doller and gross margin in percentage for software company illustrating growth trend in last five years from 2019 to 2023. It also showcases gross profit contribution by services and solutions. Deliver an outstanding presentation on the topic using this Gross Profit And Margin Software Company Financial Summary Report Ppt Diagrams. Dispense information and present a thorough explanation of Total Gross Profit, Services Gross Profit, Solutions Gross Profit using the slides given. This template can be altered and personalized to fit your needs. It is also available for immediate download. So grab it now.
People who downloaded this PowerPoint presentation also viewed the following :
Gross Profit And Margin Software Company Financial Summary Report Ppt Diagrams with all 7 slides:
Use our Gross Profit And Margin Software Company Financial Summary Report Ppt Diagrams to effectively help you save your valuable time. They are readymade to fit into any presentation structure.
-
Professionally designed slides with color coordinated themes and icons. Perfect for enhancing the style of the presentations.
-
The slides come with appealing color schemes and relevant content that helped me deliver a stunning presentation without any hassle!


