 Customer Reviews
Visualizing multi-variate comparison data is often a challenge for analysts and learners alike. The standard weapon of choice tends to be a bar graph or scatter plot, but these don’t have much visual give. However, what truly works as the precise litmus in such scenarios is the good old area chart.
Area charts are a great way to compare quantities or percentages of different items in a single chart. You can use them for many things, such as comparing the progress of two teams over time, showing how each state ranks with respect to one another in terms of education spending, and much more!
But how to get started with area charts? Why do you need one?
In this blog post, you will learn what area charts are and how they work, along with some helpful tips on using them when making PowerPoint presentations. There are downloadable templates up for grabs too! So read along and tell impressive stories with your data.
What is an area chart?
An area chart is a type of graph which uses two axes. The horizontal axis represents time, while the vertical axis shows quantity or another variable against another dimension, such as percentage change over time. The line between successive points goes from left to right, where it ends in an arrow showing directionality for that value.
There are also multiple area chart types, including stacked area graphs, 100% stacked area graphs, and 200% stacked area graphs.
Area charts are similar to line graphs but instead show data points by their area rather than their position along an axis. The X-axis represents one quantity, while the Y-axis represents another quantity or percentage. The total is always 100% so that it can easily be compared between multiple areas within the same graph.
Applications of area graph
In a general sense, area graphs are best used for the following applications:
→ Showing trend over time
→ Showing multiple parts of a whole
→ Comparing discrete categories in the past and present
→ Making comparisons between different groups or entities when they are not directly comparable (i.e. income vs. spending)
→ Providing visual detail to data that is inherently part-to-whole hierarchal by nature
→ Showing cumulative totals over time
Due to the ease of comprehension that they offer, area charts are the best tool for statistical and business applications. They also form a significant part of sales comparison reports, growth pattern studies, and more.
Drawbacks of area chart
When representing data with an area graph, several drawbacks should be considered. It may not always convey information effectively when it comes to important trends in the data, which is why other types of graphs might be better suited for certain purposes.
The stacked area chart can also become misleading because each consecutive slice will appear smaller than previous ones even if they have a larger value overall.
It would probably be best just to use a line chart instead since those don't rely on perspective and clearly show individual values along with any trend lines within them. This makes them much easier to decipher, provided there aren't too many points on the chart.
How to make an area chart?
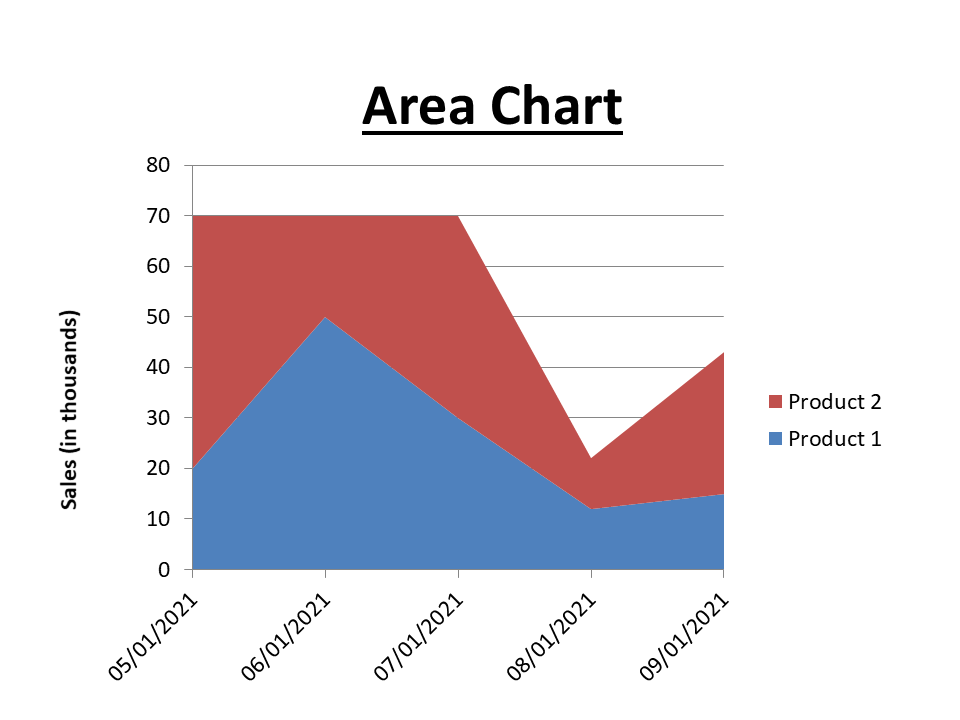
Given that you are analyzing data sets to ascertain trends and distinguish key elements, you will need to prepare an area chart for precise representation. To do that, you have the best tool in town – PowerPoint. Follow along these three simple steps to create an area graph within a few clicks in PowerPoint. For clarity, we are going to visualize monthly sales of two products with a stacked area chart. Let’s go!
Step 1: Select the Area Chart icon from the Charts section of the Insert tab.

Step 2: As per our example, we are choosing Stacked Area option to insert a pre-sized chart with an Excel file linked with it.

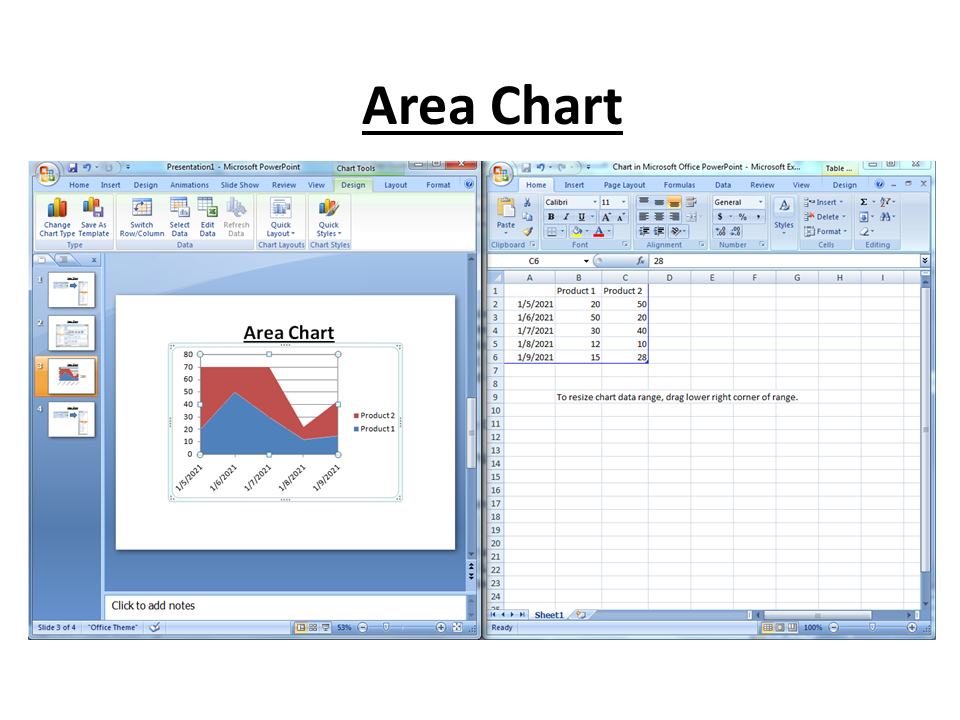
Step 3: Fine-tune the data, edit the labels, and close the Excel file. Your final stacked area chart looks like this.
You can add some finishing touches to your area chart using Format > Chart Styles option for overall style selections and Fill & Line menu for line styles and color changes of individual elements within the selected category.
Area chart PPT templates to download and deploy instantly
Area charts portray ranges of data in a compact space. If you're looking for an excellent template that provides easy-to-read visual representations of data, look no further than these 10 handpicked designs.
The best feature of these templates is that they come with linked Excel files and completely editable layouts. So you can customize anything ranging from the text to the color of the graphics used in these presets. You won’t find these stunning designs in the default PowerPoint library either. Therefore, make the smart choice and download the templates that best suit your needs.
Template 1
This template features a stacked area graph that can be used to display percentage sales over the years. From business reports to complex math problems, this area chart PPT design can also help visualize this information quickly, so it's easier to understand the concepts at hand. Take it away!

Template 2
This area chart design illustrates the underlying data clearly and concisely, making it a valuable tool for those looking to analyze key business statistics. With just a few clicks, you'll have an infographic-style visualization that highlights essential information about product sales comparison. Select this template and get going!

Template 3
Use this area graph if you want to create a crystal-clear and lucid visual model for three data sets. Using this tool couldn't be easier: import data from selected cells in Excel or other programs, then insert a title and subtitle of your choice. So choose this expressive template to examine critical data with ease.

Template 4
This is another dynamic presentation format that can be utilized to make the process of data visualization simple, effective, and informative. This creative template can assimilate three data sets into a concise format. You can also add rich color or symbolic elements to it for value addition.

Template 5
This area chart PPT template is a great tool for anyone looking to present numbers in a visually interesting way. The design depicts the percentage change in values for three products, but you can customize and add more layers to it as well. Moreover, this PPT theme can be converted into various formats, including JPEG, PNG, and PDF. So download and start sharing.

Template 6
This template is a requirement for success in sales. It depicts three data sets corresponding to growing sales figures over the year. The color-coded format of this slide makes it a perfect fit for comparative analysis. So get your hands on this creative preset and start marking your territory.

Template 7
Are you looking for a tool to help your students make sense of the business data they are swimming in? Look no further than this PPT template. It provides an interactive and compact way to visualize and study complex information about four data sets. Clearly see patterns and trends that will lead you down new paths for research with the ability to edit the template into different formats like JPG, PNG, or PDF at your convenience.

Template 8
The area chart PPT template is a great option for quickly visualizing your data and budget allocations. It includes the most commonly used functions like legends and labels. The template can be customized to include colors, fonts, and shapes to create professional presentations for school or work projects.

Template 9
This layout is a 3-D area chart that can be used as impactful imagery for reports or presentations concerning statistics. The flexible design helps you visualize innovative marketing strategies, forecast future trends, and compare operational performances over time with other companies. So wait no longer and click below!

Template 10
You want to identify trends, but is your messaging too small? Deploy this 3-D area graph template. It's professional and informative — perfect for data-driven topics like business (think: quarterly reports) or study (social studies, economics). Select this template and start customizing it.

Area charts are an effective way to visualize change over time because they give readers an immediate sense of the magnitude of difference between each set of values. If you need to display this type of information quickly or share it online, use one of our PowerPoint templates that include pre-made area chart slides! Just download and start excelling.
P.S: To master more data visualization techniques, check out our complete guide and templates here.