


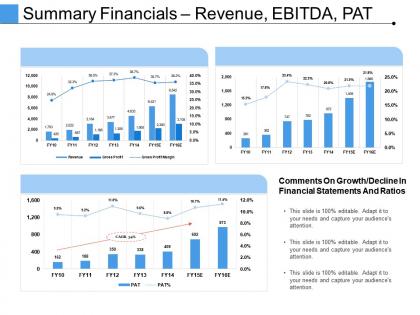
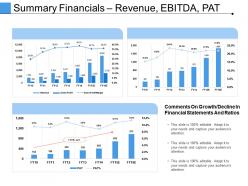
Summary financials revenue ebitda pat powerpoint slide designs




Try Before you Buy Download Free Sample Product
 Impress Your
 Audience
 100%
100% Editable
 Save Hours
 of Time


Our Summary Financials Revenue Ebitda Pat Powerpoint Slide Designs will build esteem. You will get a lot of accolades.
People who downloaded this PowerPoint presentation also viewed the following :
Summary financials revenue ebitda pat powerpoint slide designs with all 5 slides:
Communicate withclaritydue toour Summary Financials Revenue Ebitda Pat Powerpoint Slide Designs. Your thoughts come through without distortion.


FAQs for Summary financials revenue ebitda pat
Focus on the big four: revenue, profit margins, cash flow, and debt-to-equity ratios. Revenue shows growth, margins tell you if you're actually efficient at making money. Cash flow is critical though—I've literally watched profitable companies go under because they couldn't cover their bills. That's wild but it happens more than you'd think. Compare year-over-year numbers and throw in some industry benchmarks so people can put it in context. Don't dump everything at once. Start with whatever metrics your audience cares about most for their decisions.
Charts and graphs are total game-changers for financial stuff - way better than staring at endless spreadsheet rows. Bar charts work great for comparing things, line graphs show trends over time. Color coding helps too, like green for good news, red for... well, you know. Keep it simple though - I've seen people go crazy with animations and weird fonts that just distract from the actual data. Oh, and icons can be helpful if they make sense. Start with whatever metric matters most to you and build everything else around that. Trust me, your brain will thank you.
Honestly, most people either get way too vague with their numbers or dump every tiny detail on you - neither works. Focus on what actually matters to your audience, not your entire spreadsheet. Always give context too, like how this compares to last quarter or why sales dropped in March. Double-check your math because one wrong calculation and people stop trusting everything else. I learned that the hard way once! Lead with your biggest findings upfront instead of making people hunt for them. Keep it tight but don't skip the important stuff.
Yeah, it totally depends on your industry. Tech companies need to show off recurring revenue and user growth - investors eat that stuff up. Manufacturing is all about inventory turnover and production costs instead. Healthcare gets weird though, they're obsessed with R&D spending and regulatory milestones (honestly those reports are a slog to read). Retail's different again - same-store sales and seasonal patterns matter most there. You just gotta figure out what metrics actually move the needle in your space and put those right up front.
Dude, storytelling makes your financial reports way less soul-crushing to read. People actually remember stories vs just random numbers thrown at them. Picture explaining your quarter to someone at a bar instead of reading off a spreadsheet - which sounds better? You're basically connecting the dots between what went down, why anyone should care, and what's coming next. I always tell people to lead with the "so what" first, then dump the data. Be real about the messy stuff too, don't just cherry-pick wins. Makes everything flow better when you're building toward your bigger strategy.
Honestly, raw numbers by themselves don't tell you much. What I do is always throw in 2-3 years of comparison data - makes everything way clearer. So instead of "we hit $2M this quarter," show how that stacks up against last year's Q3 or whatever. Year-over-year comparisons are your best bet since executives actually understand those. You want to smooth out any random one-off stuff that might've happened. The tricky part is picking baseline periods that actually make sense for your business cycle, but once you nail that down, trends become super obvious. People can instantly see if you're crushing it or... not.
So if you're doing this a lot, definitely check out QuickBooks, Xero, or FreshBooks - they'll auto-generate summaries from your data. Excel works great too, especially with templates that have formulas pulling from your accounting software. Power BI or Tableau are solid for fancier interactive dashboards that update themselves. Honestly though, I've watched people waste hours making these things look perfect when nobody really cares about the formatting. Just start with whatever plays nice with your current accounting setup and you'll save yourself tons of data entry headaches.
Okay so basically you gotta totally flip your approach depending on who's reading it. Investors want the sexy stuff - ROI numbers, growth charts, where you're heading in the market. They don't care about nitty-gritty details. But your internal team? They need the real meat - budget breakdowns, departmental spending, how we're actually hitting targets. I swear half the internal reports I see are written like they're trying to impress some VC and everyone's just sitting there confused. Keep investor stuff big picture and future-focused. Make internal reports detailed enough that people can actually do something with the info. Quick test - what decision will they make after reading this?
Honestly, just keep it simple - clean charts, clear labels, and stick to 3-4 colors tops. Nobody wants to stare at a rainbow mess trying to figure out what's going on. Pick the right chart for what you're showing: lines for trends, bars for comparing stuff, tables only when people actually need exact numbers. Oh, and always throw in some context like "compared to last quarter" or whatever makes sense. The real test? Show it to someone first - if they look confused or squint at it, you've probably overcomplicated things. Trust me on this one.
Monthly updates are usually the sweet spot, though quarterly works fine too. If you're at a startup or cash is tight, weekly makes sense. Don't go crazy with daily tracking though - I've watched teams burn out doing that and it's just overkill. Get your summaries to leadership within a week after month-end when the numbers are actually solid. Weekly's good for fast-moving situations, but find whatever rhythm doesn't drive everyone nuts with constant reports. Oh, and set up that recurring calendar invite now or you'll totally forget.
Ugh, regulatory changes are the worst - they totally mess with your financial reports. New disclosure rules mean you're suddenly adding sections you never had before. Different categorization standards? Now you're reclassifying transactions and moving line items around. I swear the timing is always terrible too. My advice is to subscribe to regulatory alerts for your industry so you're not blindsided. Also build in extra time when you're planning your reporting calendar. Trust me, you don't want to be scrambling at 11pm trying to figure out the new format requirements.
Look, numbers alone are pretty useless tbh. Like seeing "revenue dropped 15%" doesn't tell you jack about what to actually DO about it. But when you add the story - maybe customer acquisition tanked because of new competitors, but your retention got better thanks to that onboarding thing you tried - now you're getting somewhere. That context shows you where to double down and what's clearly broken. The whole point is connecting your data to real decisions you can make. Short version: good narratives explain the "why" and give you a roadmap forward instead of just dumping stats on you.
So for your executive summary, just focus on the stuff that actually matters - revenue, profit margins, cash flow, and any big differences from what you budgeted or did last year. Most people zone out during financial stuff anyway, so make it easy to scan. Throw in any major financial events, debt levels, and what might affect future performance. I always think of it like this: if someone cornered you in an elevator and asked how the business is doing money-wise, what would you say? Bullet points are your friend here. Keep it punchy and you're golden.
Start with your key assumptions and how you built the forecast - gets you instant credibility. Always do three scenarios: best, realistic, worst case. Single-point forecasts are honestly just wishful thinking lol. Be super transparent about what's actually driving your numbers and call out the big risks. Charts and tables help people digest everything without their eyes glazing over. Connect your projections to real business stuff happening, not just "we'll grow 15%." Oh and definitely include sensitivity analysis - shows what breaks if you're wrong about something major.
Be accurate and transparent - don't cherry-pick the good stuff while hiding problems in tiny footnotes. People need to know your methodology and what assumptions you made. Complex situations shouldn't get oversimplified just because it makes the numbers prettier (seriously, that never ends well). Think about everyone affected too - employees, investors, customers. Frame things fairly for all of them. Oh, and here's my test: if you'd feel weird explaining your choices to a room full of people, you're probably doing something wrong. Trust goes out the window fast with bad data practices.
-
Use of different colors is good. It's simple and attractive.
-
Great product with highly impressive and engaging designs.