


Financial highlights


Try Before you Buy Download Free Sample Product
 Impress Your
 Audience
Editable
of Time


Build fresh hope of a brighter future with our Financial Highlights. Be able to address the demoralised.
People who downloaded this PowerPoint presentation also viewed the following :
Content of this Powerpoint Presentation
Description:
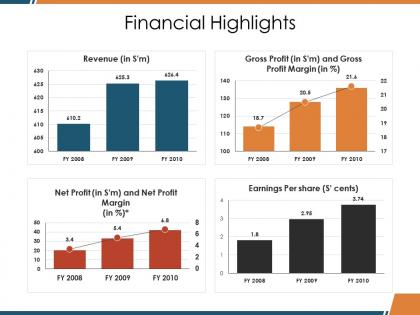
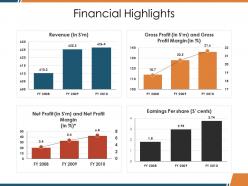
The image is a PowerPoint slide titled "Financial Highlights," presenting a company's financial performance over three fiscal years (FY 2008, FY 2009, and FY 2010). It contains four different graphs:
1. Revenue (in $'m):
A bar graph showing a slight increase from FY 2008 to FY 2009, with revenues slightly dropping in FY 2010.
2. Gross Profit (in $'m) and Gross Profit Margin (in %):
A bar graph with line overlay, indicating an increase in both gross profit and gross profit margin over the three years.
3. Net Profit (in $'m) and Net Profit Margin (in %):
Similar to the gross profit graph, this bar and line graph show increases in net profit and net profit margin over the three years.
4. Earnings Per Share (S' cents):
A bar graph showing a significant increase in earnings per share from FY 2008 to FY 2010.
These graphs are vital for stakeholders to assess the financial health and profitability trends of a company.
Use Cases:
Such financial slides can be used across various industries:
1. Banking:
Use: Showcasing annual financial performance to stakeholders.
Presenter: Chief Financial Officer
Audience: Investors, Analysts
2. Retail:
Use: Presenting yearly sales and profit trends.
Presenter: Finance Manager
Audience: Shareholders, Management Team
3. Technology:
Use: Highlighting revenue and R&D investment returns.
Presenter: Finance Director
Audience: Board Members, Investors
4. Automotive:
Use: Displaying financial outcomes from new model releases.
Presenter: CEO
Audience: Shareholders, Dealership Owners
5. Pharmaceuticals:
Use: Illustrating profit margins from drug sales.
Presenter: Head of Finance
Audience: Shareholders, Industry Analysts
6. Real Estate:
Use: Depicting financial growth from property development.
Presenter: Financial Controller
Audience: Real Estate Investors, Management
7. Energy:
Use: Explaining financial results from energy production and sales.
Presenter: CFO or Financial Analyst
Audience: Investors, Regulatory Bodies
Financial highlights with all 5 slides:
Our Financial Highlights ensure calm all around. They help avoid any disturbance.

FAQs for Financial highlights
Honestly, it's not that complicated once you break it down. Start with clear goals - write down actual dollar amounts and deadlines, makes planning so much easier. Budget realistically, build up 3-6 months expenses for emergencies, and pick investments that match how long you've got and your risk comfort level. Don't forget insurance though - I know it's boring but it protects all the other stuff you're working toward. Oh, and manage your debt obviously. The hardest part? Actually following through on whatever plan you create. Most people nail the planning part but then... yeah.
Start with just 20 or 50 bucks each paycheck - seriously, it builds up way quicker than you'd expect. Set up auto-transfer so you don't even have to remember. I'm always telling people to track spending for like 2-3 months because you'll spot weird patterns you never noticed. Also keep some buffer money in checking because unexpected stuff always happens at the worst times. Work toward 3-6 months of expenses saved up. Once you've got that cushion, random car breakdowns won't completely wreck your budget. Oh and keep it totally separate from regular savings or you'll spend it.
So inflation is basically eating away at your money while you're not looking - that $10,000 you have now? It'll buy way less stuff in a few years. Pretty annoying, right? You've gotta put your money into things that grow faster than inflation eats it up. Stocks and real estate usually do the trick since they've historically beaten inflation rates. Bonds can work too, though they're not bulletproof against it. I'd honestly avoid keeping too much cash just sitting around - maybe move some into growth investments and spread it out a bit.
So basically you spread your money around different stuff that doesn't all crash together. Stocks, bonds, maybe some international things - honestly bonds are kinda boring but they help when everything else is going crazy. One sector tanks? Cool, your other investments might actually do well that day. It's like... okay the egg basket thing is overused but it's true lol. You want things that react differently to the same news. Don't go wild right away though - start with a few different areas and add more as you figure out what you're doing.
Honestly, I love using my credit card for everything - the rewards are solid and you get way better fraud protection than with debit. Building credit history is huge too. Online shopping is obviously easier. But here's the thing - I've definitely gotten carried away before because it doesn't feel like "real money" leaving your account. Those interest rates will absolutely destroy you if you carry a balance. Like, we're talking 20%+ which makes any rewards completely pointless. My rule now? Never put anything on the card that I couldn't pay for with my debit card that same day.
So basically interest rates are like this seesaw thing for money decisions. High rates? Your savings account actually makes decent money, but loans cost way more - so you'll probably hold off on that car payment. Low rates though... your savings earn like nothing (seriously, 0.1% is insulting), so might as well spend it or throw it somewhere else. Plus borrowing gets cheap, so suddenly that mortgage doesn't look so scary. It's crazy how much this one thing pushes you around financially. Worth watching if you're planning anything big.
Look, financial literacy is what separates people who actually build wealth from those who just hope things work out. You can't make smart money moves if you don't understand the basics - budgeting, investing, how compound interest works, managing debt properly. I learned this the hard way in my twenties, honestly. Think of it like learning to drive without knowing traffic rules. Sure, you might not crash immediately, but why risk it? Once you get concepts like tax optimization and diversifying investments, building wealth becomes way more efficient. Pick one new financial topic each month and actually use it.
Honestly, tech has made managing money so much easier than when we had to track everything by hand. Apps like Mint automatically sort your spending into categories, which is pretty cool. Your savings can run on autopilot now too. Robo-advisors are handling investments better than a lot of financial advisors these days - kinda wild if you think about it. Mobile banking means no more waiting in those awful bank lines either. I'd say just download one budgeting app this week and connect your accounts. You'll probably discover spending patterns you didn't even know existed.
Dude, get your invoicing on autopilot and chase down late payments hard. Seriously, most small businesses tank because they're too nice about collecting money. Try pushing your suppliers to give you net 30 instead of net 15 - every extra day helps. Build up some cash reserves too, because slow periods always hit when you least expect them. I'd map out the next 90 days so you can see trouble coming. Oh, and check your cash flow weekly, not just whenever you remember to peek at your bank account.
Market volatility definitely messes with millennial retirement planning, but honestly it's not all bad news. You've got like 30-40 years ahead of you, which is actually huge. When everything crashes, your monthly contributions buy way more shares at cheaper prices. Inflation though? That's the real killer right now - makes it so much harder to save anything decent. The thing is, you can weather market swings that would absolutely destroy someone retiring next year. Don't freak out and change your whole strategy every time there's drama in the headlines. Keep contributing consistently, maybe even bump it up when markets tank.
Honestly, your brain is working against you when it comes to investing. Loss aversion makes you cling to bad stocks way too long - I've totally done this. Meanwhile, you'll chase whatever's trending because everyone else is doing it. FOMO will literally cost you money! Most people end up buying high and selling low because emotions take over. Dollar-cost averaging helps though, or setting up rules ahead of time for when to sell. The trick is catching yourself before you make these mistakes. Your psychological biases are probably doing more damage than you realize.
So basically, good debt helps you make money or build wealth over time - mortgages, student loans, business stuff. Bad debt just bleeds you dry without giving back anything useful. Credit cards for random purchases? Total money pit, especially at like 20% interest. Good debt usually comes with lower rates and sometimes tax breaks, plus whatever you bought might actually go up in value. I learned this the hard way with my own credit card mistakes, honestly. Before borrowing anything, just ask yourself: will this actually help my finances long-term or am I just screwing myself over?
Honestly, I'd look into whether your investments match what you actually care about. ESG stuff matters - environmental impact, how they treat workers, basic corporate ethics. Fast fashion companies might make you money but their labor practices are pretty awful. Do some digging beyond just the numbers. If your job could create conflicts with what you're investing in, be upfront about it. There are ESG rating tools and impact investing platforms that make this easier. I mean, why make money off something that keeps you up at night, right?
So basically, economic indicators are like the economy's report card that investors obsess over. Strong GDP or low unemployment? Stocks usually go up because everyone expects companies to crush it. Jobs reports and GDP data are the big ones to watch - they create pretty predictable market moves most of the time. Inflation's weird though, it can swing either way depending on what's happening. When bad numbers drop, people panic and start selling because they're worried about future earnings. Honestly, if you just track those main indicators, you'll spot the market reactions coming from a mile away.
Dude, you NEED an emergency fund. Seriously, it's like having a financial bodyguard when life decides to mess with you. Car breaks down? Medical bill out of nowhere? Boom - you're covered instead of scrambling for credit cards. I'd say shoot for 3-6 months of expenses, but honestly? Start with whatever you can. Even $500 helps when your laptop dies or something. Keep it in a separate account that's easy to get to. The peace of mind alone is worth it - I sleep way better knowing I'm not one emergency away from debt hell.
-
Helpful product design for delivering presentation.
-
Awesome presentation, really professional and easy to edit.