


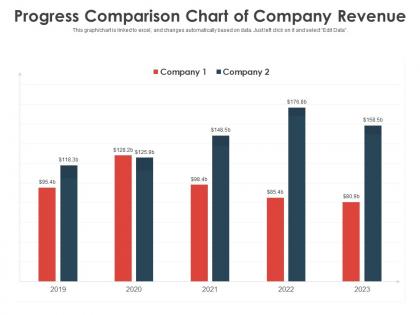
Progress comparison chart of company revenue


Try Before you Buy Download Free Sample Product
 Impress Your
 Audience
Editable
of Time


Our Progress Comparison Chart Of Company Revenue are topically designed to provide an attractive backdrop to any subject. Use them to look like a presentation pro.
People who downloaded this PowerPoint presentation also viewed the following :
Progress comparison chart of company revenue with all 2 slides:
Use our Progress Comparison Chart Of Company Revenue to effectively help you save your valuable time. They are readymade to fit into any presentation structure.

FAQs for Progress comparison chart
Businesses should consider revenue growth rate, seasonal variations, market conditions, product mix changes, customer acquisition costs, and pricing adjustments when comparing across periods. These metrics provide context beyond raw numbers, with many organizations finding that analyzing revenue per customer, market share shifts, and operational efficiency changes delivers clearer insights into true performance trends.
Seasonal trends significantly impact revenue comparison by creating predictable fluctuations in demand, inventory cycles, and consumer spending patterns across different periods. Industries like retail, hospitality, and agriculture experience pronounced seasonal variations, with retailers seeing holiday spikes and tourism businesses fluctuating by season, requiring adjusted comparison frameworks that account for these cyclical patterns to ensure accurate performance evaluation.
Pricing strategy serves as a critical differentiator in revenue comparison, directly influencing market positioning, customer acquisition, and profit margins through value-based, competitive, or penetration approaches. Companies across sectors like retail, SaaS, and manufacturing leverage strategic pricing to capture market share, optimize revenue streams, and establish competitive advantages, with many finding that dynamic pricing models ultimately deliver sustained growth and enhanced profitability.
External economic factors significantly influence revenue comparisons through inflation rates, currency fluctuations, market demand shifts, regulatory changes, and economic cycles that can distort year-over-year performance metrics. These variables require careful normalization when analyzing revenue trends, with many financial analysts finding that adjusting for economic conditions, seasonality, and market volatility delivers more accurate competitive benchmarking and strategic insights.
Comparative revenue analysis benefits startups by identifying growth opportunities, market positioning gaps, and competitive benchmarks for investor presentations, while established businesses leverage it for market share analysis, performance optimization, and strategic pivoting decisions. Through detailed revenue comparisons, startups can accelerate fundraising timelines and market entry strategies, whereas established companies streamline operational efficiency and enhance competitive advantage in increasingly dynamic markets.
Revenue comparison reveals operational inefficiencies by identifying departments, products, or time periods with disproportionately low performance relative to costs, resources allocated, or market opportunities. Through systematic analysis, businesses can pinpoint bottlenecks in production processes, underperforming sales channels, or resource allocation mismatches, ultimately enabling targeted improvements that streamline operations and enhance profitability.
Technology and data analytics enhance revenue comparison accuracy by automating data collection, standardizing financial metrics, and eliminating manual calculation errors. Through AI-powered analytics platforms, organizations streamline cross-period analysis, identify revenue trends with greater precision, and generate real-time comparative insights, while advanced algorithms detect anomalies and inconsistencies, ultimately delivering more reliable financial reporting and strategic decision-making capabilities.
Companies should avoid comparing revenues without considering business models, market conditions, seasonal variations, accounting methods, and operational scales that significantly impact interpretation. While basic revenue numbers provide initial insights, they can mislead stakeholders when context is missing, with many organizations finding that incorporating profitability metrics, growth trajectories, and market positioning delivers more strategic competitive advantage.
Revenue comparison aids forecasting by identifying growth trends, seasonal patterns, market cycles, and performance benchmarks across different periods and competitors. Through analyzing historical revenue data, businesses can project future cash flows, anticipate market fluctuations, and make strategic decisions about resource allocation, ultimately enabling more accurate financial planning and competitive positioning.
Effective methodologies for comparing revenue across diverse product lines include contribution margin analysis, revenue per unit metrics, market share assessments, growth rate comparisons, and profitability ratios. These approaches enable organizations to evaluate performance by normalizing for product complexity, pricing variations, and market dynamics, with many retail and manufacturing companies finding that strategic combination of multiple methodologies delivers comprehensive insights and competitive advantage.
Geographical differences significantly affect revenue comparisons through currency fluctuations, varying market sizes, regional economic conditions, local regulations, and different consumer purchasing power across markets. Global enterprises often find that strong performance in emerging markets may appear weaker in dollar terms due to exchange rates, while developed markets face higher operational costs, ultimately requiring businesses to analyze both local currency performance and market-adjusted metrics for accurate strategic decision-making.
Investor perspectives on revenue comparison significantly influence funding decisions by evaluating growth trajectories, market positioning relative to competitors, revenue diversification across streams, and scalability potential of business models. These assessments enable investors to identify sustainable competitive advantages, assess risk-reward ratios more accurately, and prioritize startups demonstrating consistent revenue growth patterns, ultimately directing capital toward ventures with stronger financial fundamentals and market validation.
Revenue comparison enables businesses to identify market gaps by analyzing competitor performance, sector growth rates, and geographic variations across different segments. Through systematic benchmarking against industry leaders, companies can pinpoint underperforming markets, emerging customer segments, and pricing opportunities, with many organizations finding that strategic revenue analysis reveals untapped niches and expansion possibilities that drive competitive advantage.
Customer segmentation significantly enhances revenue comparison analysis by enabling businesses to identify high-value customer groups, compare performance across different segments, and allocate resources more strategically. Through targeted segmentation, organizations can pinpoint which customer categories drive the most revenue, optimize pricing strategies for specific groups, and ultimately deliver more personalized experiences that increase profitability and competitive advantage.
Visual revenue comparison presentations enhance stakeholder communication by transforming complex financial data into clear, actionable insights through charts, graphs, and interactive dashboards. These presentations enable executives to quickly identify trends, justify strategic decisions, and align diverse audiences around financial performance, with many organizations finding that visual storytelling significantly improves board meetings and investor relations outcomes.
-
Easy to edit slides with easy to understand instructions.
-
Great experience, I would definitely use your services further.
-
Easily Editable.