






 0 Comment
 Customer Reviews

Implementing a metrics tracker, from a car fuel gauge to a weather report to fitness, requires tracking the events and capital elements around them to improve performance, communicate progress to others, and make the right decisions. If small things like cars, weather, and fitness journeys require scorecards, then large companies and businesses require revenue reporting for the similar benefits mentioned in this paragraph.
Let’s dive deep into revenue reporting and its benefits in a company.
First of all, what is revenue reporting? It is a process of letting an investor or a stakeholder know how their company is performing financially. This process is all about documenting, analyzing, and reporting the income levels of the business based on its daily activities for a particular period. Typically, the revenue is generated from sales, services to customers, subscriptions, etc. to a company.
Browse SlideTeam’s Top 10 Revenue Forecast Templates collection to stay current with trends and thrive where others falter.
Now, why is the revenue reporting important? It is crucial as it provides the complete breakdown and details of the company’s gross revenue and performance in terms of finances. Besides, it helps in financial analysis and planning, investor and stakeholder communication, compliance and regulatory requirements, operational insights, benchmarking and performance measurement, and decision-making.
What must you do to stand out while you present your next revenue to your bosses? Download our 100% editable and customized templates on revenue reporting that cover every element from revenue forecasting to revenue recognition, tax reporting to real-time reporting, and revenue metrics to key performance indicators.
Check out our top 10 revenue breakdown templates at the link provided.
Let’s explore!
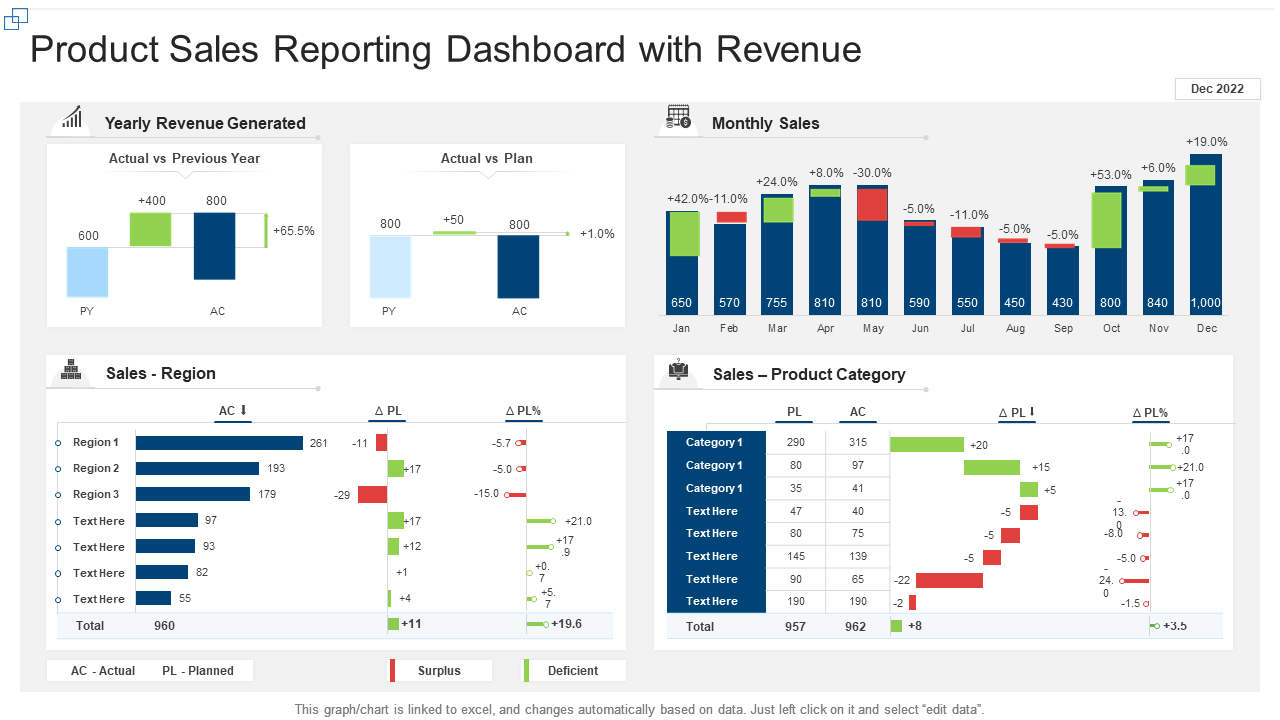
Template 1: Product Sales Reporting Dashboard with Revenue
This dashboard is crucial for revenue reporting as it contains bar charts and graphs representing important metrics like yearly revenue generated, monthly sales data, revenue generated annually compared to the previous year, sales that took place region-wise, sales based on product category, company details, and other information. This is a common yet important dashboard that every product-based company owns as they need to report how their product performed at a certain period. Having this template in your presentation may help the stakeholders understand where they must improve in terms of selling the product, how much to invest in the product in the coming months, or how to plan other marketing activities to increase the brand image of the product. So, hurry up! Download this template and see a change.
Template 2: Dashboard Reporting for Hotel with Revenue Per Available Room
If you are working for a hotel and looking after its accounts, have you ever come across a way to present your stakeholders with the hotel’s revenue analysis through a single slide? It's quite tricky, right? We have this ready-made template for you. It contains details on a monthly basis of revenue for three months in a row, giving details like how much percentage of the revenue picked up each month and how much was planned in a month. It also contains details of the revenue from last year, the month that ended last year, etc. All of these metrics are represented by bar charts and graphs, giving a visually comfortable way of passing information, especially for those who have less time to spend on you. Calculating revenue for hotels, analyzing it, and presenting it is quite a tedious task as it involves several parameters. Therefore, this slide is for you.

Template 3: Financial Revenue Operational Reporting
How important is financial revenue operational reporting? It is highly important to analyze the positives of shipping fast and increasing sales. It also helps to track how companies investing in automation make good money by reducing costs and improving profit margins. It also offers a view of the business from all aspects, providing a complete picture of performance, helping in forming decisions, tracking performance, optimizing opportunities, increasing stakeholder and investor confidence, and complying with all the regulatory laws and rules. The key components of the financial revenue operating reporting include financial statements, operational metrics, and integrated insights.

Template 4: Revenue Assurance Maturity Model with Performance and Reporting
This template gives a pictorial representation of the revenue assurance maturity model with performance and reporting. It includes details about the company, such as its name, size, geography, and organization set-up. It also includes elements like strategy and change, people and communication, coverage, technology, risk management and controls, performance and reporting, etc. The revenue assurance maturity model is an important tool for companies to avoid and mitigate revenue leaks. But how? It helps identify, prevent, and recover these leaks through efficient financial planning and reporting. It offers correct and precise revenue insights to companies, makes real-time data available, helps in complying with regulatory rules and laws, and helps in proper decision-making using data and insights.

Template 5: Revenue Cycle Showing Manager Plan and Do with Reporting
This slider is a pictorial representation of the revenue cycle, showing the manager's plan followed by doing and managing. This cycle includes elements like pre-billing review, coding analysis, coding tips, prep and delivery, claims filling, claims appeal, billing management, inquiry management, reporting, and analysis. This cycle is generally used to understand the steps involved in the revenue cycle, starting from generating, managing, and sustaining revenue. The planning stage involves having a set number of targets and KPIs, identifying the areas of improvement, and mitigating risks. Doing this involves looking after operations like sales, delivery, and billing, managing teams, and making sure customer satisfaction is attained at the end of the day. The last stage is reporting, where all of these stages are analyzed and reported to the stakeholders.

Template 6: Executing Reporting KPI Dashboard Showing..
This dashboard consists of revenue generated in a particular year, net profit margin, debt to equity, gross profit margin, and returns on equity. This dashboard is a visual representation that talks about the key performance indicators with respect to the execution phase of a business strategy or operation. It helps the team leaders and team members track how each one is performing and make informed decisions while executing tasks or strategies. Some of the key features of this dashboard include real-time data, KPIs that can be customized, interactive visualizations, and integration capabilities. Its benefits include perfect decision-making ability, accountability, efficiency in operations, real-time monitoring, transparency, and improvement all the way long.

Template 7: Revenue Distribution by Reporting Segments
This slide provides information about revenue distribution by multiple reporting segments. It includes reporting segments such as America, Europe, Greater China, Japan, and the rest of the Asia Pacific. For example, it includes details like how much revenue Apple earns in each segment, its sales, the number of stores in each segment, etc. It also talks about the revenue growth in each segment. Other segments under revenue distribution include products, services, geographies, demographics, sales channels, etc. Some of the main benefits of having revenue distribution by reporting segments are good decision-making abilities, financial planning and execution, revenue increase, reduced risks, efficiency in operations, customer satisfaction, and so on.

Template 8: Construction Company Annual Revenue Report by Business Segments
This slide showcases the annual reports of construction companies that can help to identify the revenue generated from different commercial and infrastructure projects. Its key components are project, contract value, expenses, revenue generated, and project progress. This revenue breakdown for a construction company gives details on revenue generated from various segments, including residential properties, commercial buildings, industrial areas, geographics, customer categories, project phases, etc. Some of the benefits of reporting annually are to enable better financial visibility, allocate resources properly, have good budgeting ideas, look for areas to grow and progress, reduce some of the major risks that may drain revenue, trust with stakeholders, efficiency in operations, etc.

Template 9: Business Reporting of Revenue and Expenditure Overview
This slide discusses income levels in the last 365 days, open invoices, overdue amounts, amounts paid in the last 30 days, expenses in the last 30 days, including maintenance and repair, cost of goods sold, legal and professional expenses, job expenses, and everything else. Having a proper revenue and expenditure overview by companies helps in having good financial transparency and builds trust among the stakeholders. It also helps in identifying profitable areas of the business and helps in improving or ignoring the non-profitable areas, helps in budgeting, helps in analyzing the profit and loss (P&L) statements and controlling the expenses, and helps monitor the performance and being audit-ready. It can also help identify trends in the market and manage risks safely and easily.

Template 10: Revenue Split by Reporting Region
This slide provides information about company revenue split by therapy areas. These include oncology, biopharmaceuticals, rare diseases, and other medicines. Knowing how much revenue each region has generated in a given period helps in knowing the overall contribution of the regions to the company's revenue. It helps us understand how each region is performing in terms of creating business value and sales, followed by which measures can be taken to improve the business performance in each of these areas. It can offer insights about how much to invest in each region based on the turnover, how risks can be diversified, balanced, and mitigated, how resources can be optimized, and how to stay on the edge of the competition.

Over to you!
Here's the key takeaway: By now, you will have understood the role of revenue reporting in running a successful restaurant. Preparing a PPT from scratch could be energy-draining and time-consuming, as this topic contains various aspects common to most industries. Why worry when you have PPTs handy? Don't wait! Download our PowerPoint PPT bundles and make a difference to your business now!
Check out our top 10 revenue chart templates and examples here.


