Actual Vs Budgeted Revenue Breakdown Dashboard

Rating:
90%
Actual Vs Budgeted Revenue Breakdown Dashboard
Slide 1 of 7
Favourites Favourites

Try Before you Buy Download Free Sample Product

Audience Impress Your
Audience
Editable 100%
Editable
Time Save Hours
of Time
The Biggest Sale is ending soon in
0
0
:
0
0
:
0
0
Rating:
90%
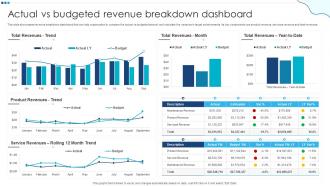
This style showcases revenue breakdown dashboard that can help organization to compare the actual vs budgeted amount and calculate the variance in target achievements. Its key components are product revenue, services revenue and total revenues Introducing our Actual Vs Budgeted Revenue Breakdown Dashboard set of slides. The topics discussed in these slides are Actual Vs Budgeted, Revenue Breakdown Dashboard. This is an immediately available PowerPoint presentation that can be conveniently customized. Download it and convince your audience.

FAQs for Actual Vs Budgeted

Track your revenue growth rate first - that's your main story. Then dig into recurring vs one-time revenue, customer acquisition trends, and average deal size. Conversion rates matter too, plus revenue per customer. Honestly, customer lifetime value vs acquisition cost is probably the most telling metric (saves you from burning cash on bad customers). Pull these monthly but don't freak out over one weird month. Look for patterns instead. Are you getting more efficient or just throwing money at problems? The quarterly view usually tells you more than obsessing over month-to-month noise.

Look, you need at least 2-3 years of data to see what's actually happening with your business. Historical numbers show you the real deal - when your busy seasons hit, how customer buying patterns work, stuff like that. Way more reliable than just winging it, honestly. You'll spot what caused those random revenue spikes or why sales tanked that one quarter. Plus you can figure out your actual sales cycle length instead of guessing. My old boss used to just make up forecasts and... yeah, that didn't end well. Bottom line: past performance tells you what normal looks like so you can build from there.

Look, customer segmentation is basically your cheat code for figuring out who's actually making you money versus who just looks good in reports. You'll spot your MVPs and see which groups are tanking or coasting. Honestly, it's wild how clear everything becomes once you break it down - like suddenly having glasses after being blind. Most businesses find that 20% of customers generate 80% of revenue, or certain groups stick around way longer. Just start grouping your current customers by spending habits, behavior, or basic demographics. Then watch the revenue patterns for each group. You might be shocked at what you discover.

Set up automated tracking in your accounting software first - separate your MRR and ARR from one-time sales. The real pain is getting clean data though, garbage in garbage out for sure. Build dashboards showing revenue cohorts, churn rates, and expansion revenue. Customer lifetime value and monthly retention rates matter way more than topline numbers honestly. I'd start simple with a month-over-month recurring revenue report and add complexity later. Oh and retention rates will probably surprise you at first - they did for me.

Yeah, pricing is huge for revenue - honestly it's the quickest way to move your numbers. You're hitting both how much people buy AND what they pay per sale. Go too low and you're basically giving money away (even when sales are strong). Too high kills demand obviously. Finding that sweet spot comes down to where you sit in the market, how price-sensitive your customers are, and what competitors are doing. My advice? Test different price points instead of just winging it. I've seen tiny pricing tweaks create massive revenue changes - it's kinda wild how sensitive it can be.

Map out your whole revenue flow first - quote to actual cash hitting your account. That's where money disappears. Check for gaps between your CRM, billing, and accounting systems because those disconnects will kill you. I swear I've watched companies hemorrhage thousands just from typing mistakes during data entry! Automated alerts are clutch for catching weird pricing issues or delayed invoices. Monthly revenue waterfall reports help track every dollar so nothing slips through. Oh, and those regular reconciliation meetings? They're boring but they work. You'll spot problems way faster this way.

Honestly, tech makes revenue analysis so much faster and way more precise. Auto-collect data from everywhere, get AI to catch trends you'd totally miss, real-time dashboards that just update themselves. Predictive analytics will forecast your revenue patterns - seriously feels like having superpowers sometimes! Machine learning finds weird anomalies and opportunities buried in your data that would take you ages to spot manually. Oh, and start simple with automated reports first. Don't go crazy with the fancy stuff right away - let your team get used to it, then add the more complex analytics later. Trust me on this one.

Okay so here's what I've learned from way too many painful exec presentations - stick with basic bar and line charts. Bar charts are clutch for comparing revenue between quarters or whatever, line charts for trends over time. Don't try to cram everything into one chart because honestly? Execs have zero patience for that. Keep your colors consistent and label stuff clearly. Oh and this is huge - your chart titles should actually say something useful, not just "Q3 Revenue" but like what it means for the business. I swear half the battle is just making it dead simple to understand at a glance.

Dude, seasonal swings will absolutely wreck your cash flow if you don't see them coming. Look at retail during Christmas or ice cream shops in July - some businesses make like half their money in just a few months. You need at least 3 years of data to figure out your patterns, then work those into your budgets. I almost went broke during what should've been a "normal" slow period because I didn't plan for it. Honestly, most people underestimate how brutal the quiet months can be. Start tracking monthly revenue now. Save cash during busy times and dial back marketing when things slow down.

Don't get fooled by big revenue numbers if they're built on shaky ground. Like, what's the point of celebrating growth when you're bleeding money on customer acquisition or relying on constant discounts? Track stuff that actually matters - customer lifetime value, how much revenue repeats vs one-time buys, your actual profit margins. Seasonality trips people up constantly too (honestly drives me crazy watching teams freak out over predictable holiday dips). Build dashboards showing these deeper numbers alongside revenue. You'll catch red flags way earlier instead of scrambling when things fall apart.

So basically you're checking what everyone else charges and hunting for gaps you can jump on. Look at their pricing vs features - maybe they're way overpricing stuff you do cheaper. Also pay attention to how they package things differently than you do. Their revenue models might give you ideas too (subscription, one-time, usage-based). Honestly the customer segments part is huge - they could be hitting markets you totally missed. I'd use all this to tweak your prices, find those underserved spots, or maybe even switch up your whole revenue approach if theirs looks way more profitable.

Honestly, just stick to what execs actually care about - total revenue, growth rate, and how much is recurring vs one-time. Customer acquisition cost and lifetime value are clutch too. Churn rate obviously matters a ton. If you're SaaS, monthly recurring revenue is basically non-negotiable. Pipeline stuff like conversion rates and deal size will round it out nicely. Oh and geographic breakdown if that's relevant for you guys. But seriously, cap it at like 6-8 metrics or they'll zone out completely. I've seen way too many dashboards that are just metric overload.

So revenue analysis is actually pretty cool for finding patterns in your best customers - like what keeps them coming back and spending more. I'd start by looking at how often they buy, their average order amounts, and which products create repeat buyers. Honestly, the data becomes kind of addictive once you dive in! Segment your customers by lifetime value first. Then check what behaviors your top spenders have in common. You can use those insights to find similar prospects and create better retention strategies. It's way more straightforward than it sounds.

Dude, you're sitting on a goldmine with your existing customers. Upselling and cross-selling are where the real money is - way easier than chasing new people constantly. Look at premium tiers or add-on services that actually solve problems they already have. Usage-based pricing can work really well too, depending on your setup. Most companies totally miss this because they're obsessed with leads. Try loyalty programs or discounts for paying annually. Timing matters though - hit them when they're actively using your stuff or bumping up against limits. I'd start by checking your customer segments first and see where upgrades make sense naturally.

Think of macro data as your crystal ball for revenue planning. When unemployment jumps, people stop spending - so you'll want to dial down those projections. Inflation hits you twice: higher costs AND customers with less disposable income (though honestly, the timing depends on what industry you're in). GDP growth and consumer spending trends will show you where things are headed way before it shows up in your actual numbers. Instead of scrambling to react later, build 3-4 key indicators into your forecasting models. Pick the ones that actually match your revenue patterns historically.

Ratings and Reviews

90% of 100
Write a review
Most Relevant Reviews
  1. 100%

    by Dwayne Matthews

    SlideTeam is my one-stop destination for templates. Highly recommended!
  2. 80%

    by Dirk Kelley

    It saves your time and decrease your efforts in half.

2 Item(s)

per page: