


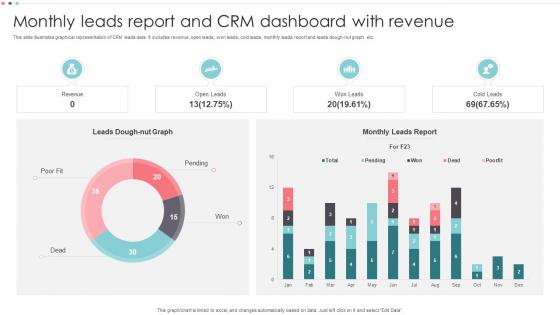
Monthly Leads Report And CRM Dashboard With Revenue




Try Before you Buy Download Free Sample Product
 Impress Your
 Audience
 100%
100% Editable
 Save Hours
 of Time


This slide illustrates graphical representation of CRM leads data. It includes revenue, open leads, won leads, cold leads, monthly leads report and leads dough-nut graph etc.
People who downloaded this PowerPoint presentation also viewed the following :
Monthly Leads Report And CRM Dashboard With Revenue with all 7 slides:
Use our Monthly Leads Report And CRM Dashboard With Revenue to effectively help you save your valuable time. They are readymade to fit into any presentation structure.





FAQs for Monthly Leads Report And CRM
Track your total leads and where they're coming from first. Conversion rates by channel matter too, plus cost per lead. But here's the thing - quality beats quantity every time, so watch your lead-to-opportunity rate and average deal size. Response time is huge (seriously, following up fast makes or breaks deals). Month-over-month growth shows if you're actually moving the needle. Oh, and pipeline velocity - that tells you how quickly deals are moving through. Start with these basics, then add whatever specific stuff your team needs. You want the full story, not just vanity numbers.
So the Monthly Leads Report is basically your reality check - shows you which marketing stuff actually works vs. what's just eating your budget. You can spot your best converting demographics and see seasonal patterns. Honestly, most people ignore the geographic breakdown but it's gold for tweaking regional campaigns. Look at your conversion rates and move money from the losers to whatever's crushing it. The lead quality scores will tell you if you need to adjust targeting. Just pull it monthly, compare the trends, and - oh, this sounds obvious but - actually act on what it's telling you instead of filing it away.
Start with whatever CRM you're already using - Salesforce, HubSpot, Pipedrive, they're all fine. For basic number crunching, Excel or Google Sheets will do the job. Google Analytics is a must for tracking lead sources (seriously, you'll be shocked where traffic actually comes from). If you want prettier charts later, Power BI or Tableau look impressive in presentations. But honestly? The specific tool doesn't matter nearly as much as just being consistent about tracking everything. I'd say start simple with what you have, then worry about fancy upgrades once you know what data you actually care about.
Yeah, seasonal stuff totally affects leads and you should track it. B2B always dies in December, retail goes crazy before holidays - pretty predictable patterns across industries. I'd throw in year-over-year comparisons so you can actually see the trends. Your leadership's gonna ask about any dips anyway, so might as well beat them to it. Add like a little "seasonal context" box calling out what's hitting that month's numbers. Way better than just dumping raw data on people - actually had a boss who loved when I did this because it saved him from having to explain the December slump to his boss.
Definitely start with lead source - that's gonna be your biggest win for seeing what's actually working. After that, break it down by company size or industry, whatever makes sense for your sales team. I usually add something time-based too, like new vs returning visitors, because honestly those patterns can be pretty eye-opening. Just don't go crazy with segments or you'll hate your life trying to make sense of it all. Stick to maybe 3-4 that your sales people actually care about. You can always dig deeper later if something looks interesting.
Dude, charts and graphs are a total game-changer for your Monthly Leads Report. People's eyes just glaze over when they see endless spreadsheet data - trust me, I've been there. Bar charts work great for comparing lead sources, and line graphs show trends over time perfectly. Oh, and funnel visualizations are clutch for conversion rates. The trick is matching the right visual to each metric so people actually pay attention instead of mentally checking out. Honestly, even one chart per key metric makes a huge difference. Your stakeholders will thank you for not making them decode rows of numbers.
Dude, timing is everything with conversion tracking - learned that the hard way when my reports looked awful one month! You're gonna miss tons of leads if you measure too early. Some people take weeks to decide, especially on big purchases. I'd track conversions for at least 30-60 days to get the real picture. Here's what works: show immediate conversions AND trailing ones from last month's leads in your reports. Gives you way better insight into what's actually driving results. Trust me, those "late bloomers" can totally change your numbers.
Honestly, track both but don't let lead volume fool you. I've watched teams get burned celebrating huge lead numbers when half were garbage. Quality metrics matter just as much - conversion rates by source, lead scoring, time-to-close stuff. The real game-changer? Cost-per-qualified-lead instead of just cost-per-lead. That'll show you which channels actually bring in buyers vs. window shoppers. Break it down so stakeholders can see the full picture. Way too many people focus on vanity metrics and wonder why their pipeline sucks later. Show which sources deliver real value and you'll know where to double down your spend.
So here's what worked for us - pick one person from each department (marketing, sales, ops) to own their section's data. Mid-month, do a quick 15-minute call to spot any weird gaps early. Trust me, catching stuff then beats scrambling at deadline. Everyone should cross-check their numbers beforehand too. Oh, and definitely set up a shared spreadsheet where people can flag issues as they happen - way better than finding out your data's messed up after you've already sent the report. Make a simple checklist that each team has to sign off on. Honestly saves you so much stress later.
Honestly, don't get caught up in total lead volume - I learned that the hard way. Quality matters way more than quantity. Track your conversion rate and cost per lead, obviously, but the real goldmine is measuring lead-to-opportunity and lead-to-customer rates. That tells you if people are actually buying or just wasting your time. Keep tabs on which channels perform best too since some sources are total duds. I'd set up a quarterly dashboard comparing these metrics. Makes it super easy to see what's crushing it vs what needs to get axed.
Show both percentage and actual numbers for each lead source - gives you the complete story. Month-over-month tables work great because execs love those red/green arrows (makes their job way easier). When you see big changes, throw in a quick explanation about what might've caused it - seasonal stuff, campaign tweaks, whatever. Context beats raw data every time. Oh, and focus on your top 3-5 sources, then lump the rest into "other." Nobody wants to scan through 20 tiny sources anyway. Your stakeholders will actually read it that way.
Tracking lead nurturing stages is clutch because it shows you exactly where prospects get stuck. Like, if you've got a bunch of leads hitting "demo scheduled" but then just... sitting there? That's your problem right there. I actually love this metric way more than basic lead counts - it tells the real story. You can see which stages are bottlenecks, figure out timing between phases, and honestly it makes deciding where to focus your team super obvious. Then just tweak your nurturing campaigns based on what the data's telling you. Way better than guessing.
Honestly, dig into your old reports to find what actually drove quality leads. Those winning channels and campaigns? Double down on them with more budget. Timing matters too - I've seen businesses crush it in certain months or days consistently. Don't ignore the failures though. Figure out what tanked so you won't waste money again (learned this the hard way). Each report is basically intel for your next move, not just some scorecard to file away. Once you start seeing clear patterns emerge, it gets pretty exciting - like finally cracking the code on what makes your audience tick.
Oh man, Monthly Leads Reports can be tricky! The biggest trap is assuming correlation equals causation - like, just because leads jumped during your campaign doesn't mean that's what caused it. Data quality will mess you up too. Duplicate entries, missing info... it's honestly such a pain. Plus attribution gets weird when leads touch multiple channels before converting - which one actually worked? My take: clean your data first (seriously, don't skip this), then look at trends across several months instead of obsessing over one month's numbers.
Dig into that Monthly Leads Report and you'll spot exactly where your team's dropping the ball. Check conversion rates by lead source and follow-up timing - the patterns are usually pretty obvious once you look. See which reps are killing it vs. who's struggling? That's your roadmap right there. Build role-playing around actual scenarios from the report, or have your struggling guys shadow the top performers. Way better than those generic sales trainings that don't fix anything. Honestly, being specific about your actual problems makes all the difference instead of just hoping broad training will somehow work.
-
Appreciate the research and its presentable format.
-
Fantastic collection. Loved how we can personalize these templates as per the requirements.