Business pie chart with annual sales
Our Business Pie Chart With Annual Sales are explicit and effective. They combine clarity and concise expression.
You must be logged in to download this presentation.
PowerPoint presentation slides
Presenting this set of slides with name Business Pie Chart With Annual Sales. The topics discussed in these slide is Business Pie Chart With Annual Sales. This is a completely editable PowerPoint presentation and is available for immediate download. Download now and impress your audience.
People who downloaded this PowerPoint presentation also viewed the following :
Content of this Powerpoint Presentation
Description:
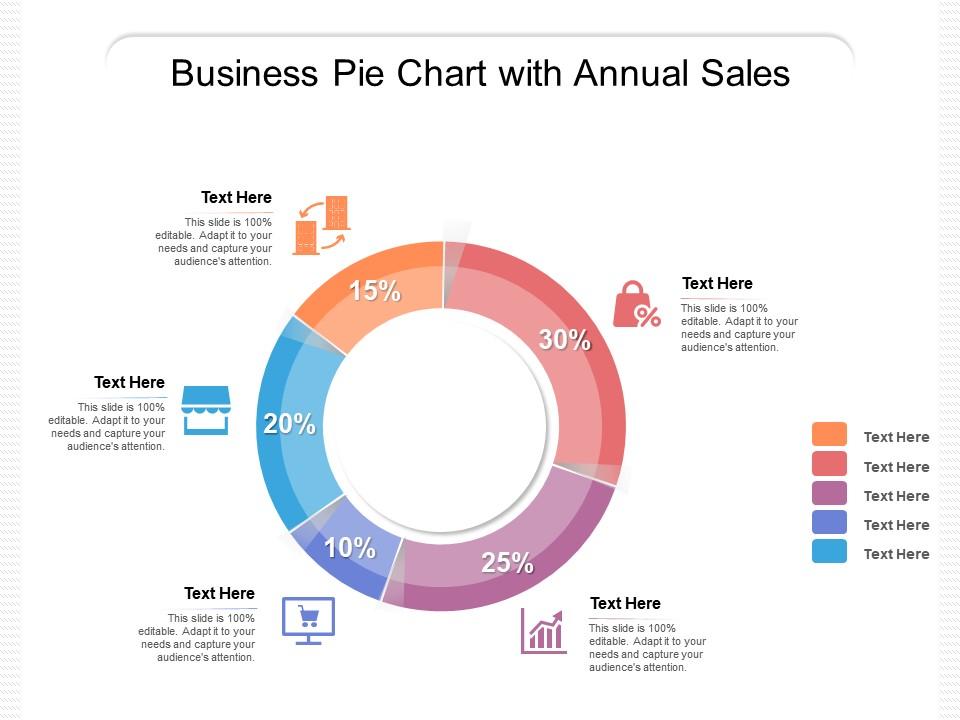
The image is of a PowerPoint slide entitled "Business Pie Chart with Annual Sales," which features a central pie chart divided into five colored segments, each with a corresponding percentage value indicating a share of the total. These segments are as follows:
1. A red segment at 30%,
2. A pink segment at 25%,
3. A blue segment at 20%,
4. An orange segment at 15%,
5. A light blue segment at 10%.
To the left and right of the pie chart are text placeholders accompanied by small icons, indicative of the type of data or category that each pie chart segment represents. The icons include a shopping cart, a factory, a lock, and others that are not fully visible, each suggesting a potential application such as sales channels, product types, or security measures. The text placeholders read "Text Here," signaling the presenter to insert specific information pertinent to the data displayed on the chart.
At the bottom of the slide, there is another text placeholder for additional descriptions or data interpretation. Each text box on the slide includes a note that the slide is "100% editable," emphasizing the customizable nature of the presentation to suit different needs and to attract the audience's focus.
Use Cases:
The pie chart is a common visual tool used for displaying proportions and can be applied across various industries:
1. E-commerce:
Use: Showcasing revenue by product category.
Presenter: E-commerce Manager.
Audience: Marketing Team, Investors.
2. Automotive:
Use: Breaking down sales by vehicle model.
Presenter: Sales Director.
Audience: Dealership Owners, Sales Teams.
3. Consumer Goods:
Use: Illustrating market share of different product lines.
Presenter: Brand Manager.
Audience: Retail Partners, Marketing Department.
4. Hospitality:
Use: Displaying room sales by category.
Presenter: Revenue Manager.
Audience: Hotel Staff, Management.
5. Pharmaceuticals:
Use: Reporting sales of medications by therapeutic area.
Presenter: Business Analyst.
Audience: Executives, R&D Teams.
6. Energy:
Use: Visualizing sales distribution across energy types.
Presenter: Marketing Strategist.
Audience: Stakeholders, Policy Makers.
7. Telecommunications:
Use: Demonstrating revenue from various service packages.
Presenter: Financial Planner.
Audience: Management, Investor Relations.
Business pie chart with annual sales with all 2 slides:
Give your audience a fulfilling experience. They will find our Business Pie Chart With Annual Sales elevating.
No Reviews


