


Portfolio Dashboard Showing Budget Tracking Metrics





Try Before you Buy Download Free Sample Product
 Impress Your
Audience
 100%
Editable
 Save Hours
of Time


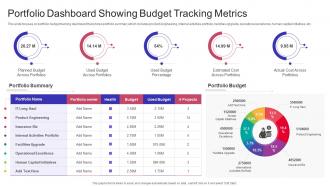
This slide focuses on portfolio budget tracking dashboard that shows portfolio summary which includes product engineering, internal activities portfolio, facilities upgrade, operational excellence, human capital initiatives, etc.
People who downloaded this PowerPoint presentation also viewed the following :
Portfolio Dashboard Showing Budget Tracking Metrics with all 7 slides:
Use our Portfolio Dashboard Showing Budget Tracking Metrics to effectively help you save your valuable time. They are readymade to fit into any presentation structure.






FAQs for Portfolio Dashboard Showing
**INPUT**: What key metrics should be included in an effective budget dashboard? **OUTPUT**: Effective budget dashboards include actual vs. budgeted spending, variance analysis, cash flow projections, departmental cost breakdowns, and revenue tracking metrics. These components enable organizations to streamline financial oversight by identifying spending patterns, forecasting potential shortfalls, and enhancing resource allocation decisions, with many financial teams finding that comprehensive dashboards ultimately deliver improved cost control and strategic financial planning capabilities.
Visualization techniques enhance budget understanding by transforming complex financial data into intuitive charts, graphs, and interactive dashboards that reveal spending patterns, variance trends, and resource allocation insights. Through visual representations like heat maps and progress indicators, finance teams streamline analysis, identify cost-saving opportunities more quickly, and communicate budget performance effectively across departments, ultimately enabling faster decision-making and improved financial transparency.
Best practices for designing user-friendly budget dashboards include clear visual hierarchy, intuitive navigation, real-time data integration, customizable filtering options, and mobile responsiveness. These design principles enhance decision-making by streamlining financial analysis, reducing cognitive load, and enabling faster budget tracking, with many finance teams finding that well-designed dashboards significantly improve operational efficiency and strategic planning accuracy.
Budget dashboards should be updated monthly for comprehensive reviews, with weekly updates for key metrics and daily updates for critical financial indicators like cash flow and spending alerts. This tiered approach enables organizations to maintain strategic oversight while responding quickly to financial changes, with many companies finding that automated daily data feeds combined with monthly analytical reviews deliver optimal accuracy, operational efficiency, and timely decision-making capabilities.
Popular software tools for budget dashboards include Microsoft Power BI, Tableau, Excel, QuickBooks, and specialized platforms like Adaptive Insights and Planful. These technologies streamline financial visualization by automating data integration, enabling real-time reporting, and delivering interactive analytics, with many organizations finding that comprehensive dashboard solutions enhance decision-making speed and budget accuracy significantly.
Organizations tailor budget dashboards by customizing metrics, visualization formats, access permissions, reporting frequencies, and departmental KPIs to match specific operational requirements. Through configurable interfaces, finance teams enable marketing departments to track campaign ROI, while operations focus on cost-per-unit metrics, ultimately delivering targeted insights that enhance decision-making and departmental accountability.
Data integration serves as the foundation of budget dashboard functionality by consolidating financial data from multiple sources, ensuring real-time accuracy, and enabling comprehensive budget tracking across departments and projects. This seamless integration allows organizations to monitor spending patterns, identify variances, and make informed financial decisions quickly, with many companies finding that unified data streams significantly enhance their budget oversight and strategic planning capabilities.
Budget dashboards enhance forecasting by integrating historical spending patterns, real-time financial data, and predictive analytics to project future performance trends. These tools enable finance teams to model various scenarios, identify seasonal variations, and adjust projections based on current market conditions, with many organizations finding that automated forecasting reduces planning time while improving accuracy.
Common pitfalls include overloading dashboards with excessive metrics, poor data integration creating inconsistencies, lack of user training, and inflexible designs that don't adapt to changing needs. Organizations often struggle with unclear objectives and inadequate stakeholder input during development, ultimately compromising adoption rates and decision-making effectiveness across finance teams.
A budget dashboard facilitates better decision-making by providing real-time financial visibility, automated variance analysis, and centralized performance metrics that enable stakeholders to identify trends and allocate resources strategically. Through interactive visualizations and customizable reporting, organizations streamline budget reviews, enhance cross-departmental collaboration, and accelerate response times to financial challenges, ultimately delivering improved operational efficiency and competitive advantage.
Templates for budget dashboards offer standardization, time efficiency, professional design, consistency across departments, and reduced development costs. These pre-built frameworks streamline financial reporting by providing proven layouts, automated calculations, and industry best practices, with many organizations finding that templates accelerate implementation while ensuring compliance and visual consistency across all budget presentations.
Mobile accessibility enhances budget dashboard effectiveness by enabling real-time financial monitoring, immediate decision-making capabilities, and seamless collaboration across teams regardless of location. Through responsive design and intuitive interfaces, executives and finance managers can track expenses, approve budgets, and identify cost-saving opportunities instantly, ultimately delivering faster financial responses and improved organizational agility.
**INPUT**: What strategies can improve user engagement with the budget dashboard? **OUTPUT**: Effective strategies include personalized data visualization, interactive drill-down capabilities, real-time alerts for budget variances, mobile accessibility, and automated reporting features. These approaches enhance user engagement by streamlining financial monitoring, enabling faster decision-making, and delivering intuitive experiences, with many finance teams finding that customizable dashboards ultimately improve budget compliance and organizational transparency. [Word count: 54 words]
Incorporating real-time data feeds into budget dashboards involves API integrations, automated data pipelines, cloud-based synchronization, and direct database connections from financial systems. These technologies streamline budget monitoring by eliminating manual updates, providing instant variance alerts, and enabling immediate decision-making, with many organizations finding that real-time visibility significantly enhances financial control and operational agility.
Budget dashboards for non-financial audiences can be customized through simplified visualizations like pie charts and progress bars, color-coded indicators for quick status recognition, plain-language summaries replacing financial jargon, and department-specific views highlighting relevant metrics. These modifications enable teams across marketing, operations, and HR to engage meaningfully with budget data, ultimately improving cross-departmental collaboration and financial accountability.
-
Out of the box and creative design.
-
Much better than the original! Thanks for the quick turnaround.