


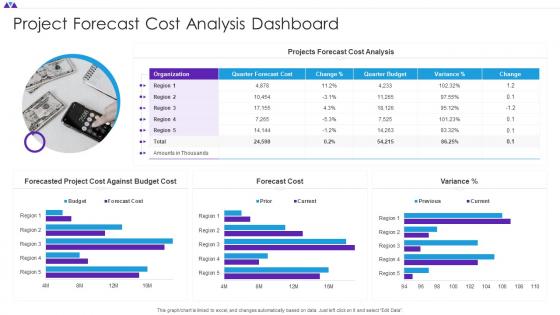
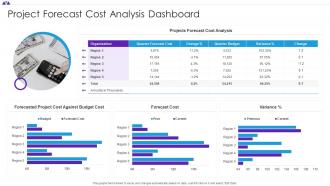
Project Forecast Cost Analysis Dashboard Snapshot




Try Before you Buy Download Free Sample Product
 Impress Your
 Audience
 100%
100% Editable
 Save Hours
 of Time


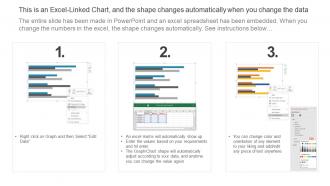
This graph or chart is linked to excel, and changes automatically based on data. Just left click on it and select Edit Data.
People who downloaded this PowerPoint presentation also viewed the following :
Project Forecast Cost Analysis Dashboard Snapshot with all 7 slides:
Use our Project Forecast Cost Analysis Dashboard Snapshot to effectively help you save your valuable time. They are readymade to fit into any presentation structure.





FAQs for Project Forecast Cost
So basically there's time series analysis - that's just looking at historical patterns and it's super popular in retail/finance. Most people start there since it makes sense intuitively. Then you've got regression models and machine learning stuff like neural networks. Manufacturing companies usually go for causal models that include economic indicators, while tech companies are obsessed with ML for demand forecasting. Oh, and there's qualitative methods too - expert judgment and market research work well when you don't have much past data to work with. I'd probably start simple with time series for whatever you're doing, then make it more complex once you see how it performs.
Make forecasting part of your quarterly reviews instead of doing it once and forgetting about it. Use different methods - trend analysis, scenario planning, market research - so you're not putting all your eggs in one basket. Most companies seriously just wing this stuff, which honestly blows my mind. Figure out what actually drives your business first. Then create best case, worst case, and realistic scenarios. Actually use these to decide where you'll spend money and what moves to make next. Oh, and update them when new info comes in - your March forecast shouldn't be gospel in September.
Honestly, big data is a game changer for forecasting. You're not stuck with just old historical data anymore - now you can pull in real-time stuff like social media trends, weather, economic signals, customer patterns, whatever. Machine learning finds connections in all that data that we'd totally miss. Way better than the Excel days (though I still use Excel for everything lol). Just don't get overwhelmed by all the noise - focus on what actually moves the needle for your specific situation.
Honestly, external stuff can wreck your forecasting if you're not careful. COVID was the perfect example - completely destroyed everyone's demand predictions overnight. Economic changes, new regulations, social shifts... they all create these breaks in your historical patterns that make old data pretty useless for future predictions. You've got a couple options: build those external variables right into your model as features, or at least track them as early warning signals. I'd probably do both if I'm being honest. Just stay plugged into what's happening in your space and regularly check if your model's assumptions still make sense.
Honestly, the worst thing you can do is just look at past data and assume everything stays the same - like, conditions change constantly. Your own biases mess things up too, plus people get way too specific with predictions when they should be giving ranges instead. Oh, and ignoring outside factors that could completely wreck your forecast? Huge mistake. Try using different forecasting methods together. Test your assumptions regularly and do scenario planning for various outcomes. Track how accurate you've been over time - I can't stress this enough. Actually learn from your screwups instead of pretending they didn't happen.
So there's basically two ways to forecast stuff. Quantitative uses all your historical data - sales trends, regression models, that kind of math-heavy approach. Works great when you've got solid past data to build from. Qualitative is more about expert opinions and surveys, honestly feels like educated guessing sometimes but it's not as random as it sounds. I'd go qualitative for new product launches or when you're entering totally unfamiliar markets. Past data won't help you there. If you've got reliable historical info though, stick with quantitative - way more reliable.
Honestly, AI and machine learning are where it's at right now. These tools can catch patterns in huge datasets that would take humans forever to spot. Predictive analytics has gotten insanely good - supply chains, weather, you name it. Real-time IoT data makes everything way more accurate than those old statistical models we used to deal with. Plus AWS and Azure have made this stuff accessible to smaller companies now, not just the big players. My advice? Start messing around with basic ML forecasting in your industry. Even simple stuff can put you ahead of competitors who haven't jumped on this yet.
Track MAPE (Mean Absolute Percentage Error) to see how close your forecasts actually hit. Under 20% is decent for most stuff, but honestly depends on your industry. Also measure the real impact - did better forecasts actually cut inventory costs or make customers happier? Set up a monthly dashboard comparing forecasts vs what really happened. Don't forget to track how often you're revising forecasts too. That frequency tells you a lot about your process. Definitely celebrate when your predictions help make solid business calls - those wins keep the team motivated.
Dude, having multiple people work on forecasts is a game changer. You'll catch so many blind spots when someone from sales talks customer trends while ops mentions capacity issues you forgot about. It's way harder to be ridiculously optimistic when your teammate's sitting there questioning everything - which honestly is annoying but super helpful. Different perspectives help you spot risks and opportunities you'd totally miss flying solo. Everyone actually believes in the final numbers since they helped create them. Oh, and the discussions usually surface stuff that seems obvious after but wasn't before. Always get at least one other person reviewing big forecasts.
Look, your forecasts have real consequences - people get hired or fired, budgets get slashed, whole departments pivot based on your numbers. So don't oversell your confidence. Be honest about what you don't know and where things could go sideways. Historical data is sneaky too - it'll bake in all sorts of old biases if you're not careful. Document everything so people can actually check your work later. I've seen too many analysts just tell executives what they want to hear (career suicide, honestly). Always think about who gets screwed if you're wrong, then spell out those risks upfront.
Honestly, ditch the single-point predictions - they're basically useless. Build scenarios instead: best case, worst case, most likely outcome. Trust me on this one. Last year our "bulletproof" model totally whiffed on a major market shift, so yeah... learned that lesson hard. Rolling forecasts work way better than those rigid annual plans nobody updates. Oh, and track leading indicators - they'll give you a heads up when stuff's about to change. Accept that you'll be wrong sometimes and just build in buffers. Way less stressful.
Honestly, purchase history is your best bet - people's actual spending tells you way more than what they claim they'll buy. Then I'd look at demographics to break down your segments properly. Economic stuff like disposable income matters too, especially right now with everything being so expensive. Social media sentiment is actually getting pretty decent for real-time insights, way better than those old surveys nobody fills out honestly anyway. Don't just pick one though - maybe combine purchase data with demographics and current economic conditions. That combo usually works best for forecasting.
So basically, short-term stuff (like days to months ahead) is way easier because you can just look at recent trends and use moving averages. The data's pretty reliable there. But long-term? Honestly that's where it gets messy - you're basically guessing about economic shifts and market changes that haven't even happened yet. I learned this the hard way on a project last year. The further out you forecast, the less confident you should be. My take: use short-term forecasts for actual planning, but treat anything years out more like different scenarios you're exploring.
Honestly, scenario planning is a game changer for forecasting. Instead of betting everything on one prediction, you map out 3-4 different futures - best case, worst case, most likely outcome. Then you test your forecasts against each scenario to see what breaks. It's like stress-testing but for predictions, I guess? The cool thing is you'll catch assumptions and blind spots that would totally screw you over otherwise. Plus you end up with backup plans already figured out. Just start with your biggest uncertainties and build scenarios around those - way better than crossing your fingers and hoping you're right.
Honestly, ML is pretty great for this stuff - it catches patterns you'd never spot manually. Seasonal trends, weird outliers, relationships between variables that make no sense until the algorithm finds them. Way better than drowning in spreadsheets (been there, not fun). The cool part is these models actually get smarter as new data comes in. Your forecasts improve automatically. Prophet's a good starting point - super user-friendly compared to the more complex stuff like LSTM networks. Just run it on whatever data you've got now and see how it stacks up against your current method. You'll probably be surprised.
-
“Excellent service from the customer support team when I wanted a slide that was a bit different from those on their standard menu. Super helpful.”
-
Very unique, user-friendly presentation interface.