

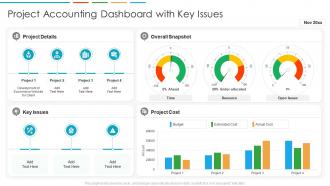
Project accounting dashboard with key issues





Try Before you Buy Download Free Sample Product
 Impress Your
 Audience
 100%
100% Editable
 Save Hours
 of Time


Our Project Accounting Dashboard With Key Issues are topically designed to provide an attractive backdrop to any subject. Use them to look like a presentation pro.
People who downloaded this PowerPoint presentation also viewed the following :
Project accounting dashboard with key issues with all 10 slides:
Use our Project Accounting Dashboard With Key Issues to effectively help you save your valuable time. They are readymade to fit into any presentation structure.









FAQs for Project accounting dashboard
Project accounting dashboards should include budget variance, actual vs. planned costs, revenue recognition, project profitability margins, resource utilization rates, and cash flow projections. These KPIs enable project managers and financial teams to monitor cost overruns, track billing efficiency, and optimize resource allocation, with many organizations finding that real-time visibility ultimately delivers improved project outcomes and enhanced profitability.
A project accounting dashboard enhances decision-making by providing real-time visibility into budget performance, cost trends, resource allocation, and profitability metrics in centralized views. Through automated reporting and predictive analytics, project managers can identify budget overruns early, optimize resource deployment, and make data-driven adjustments, ultimately delivering projects on time and within budget while maximizing ROI.
**INPUT**: What tools are most effective for creating an interactive project accounting dashboard? **OUTPUT**: Effective tools for interactive project accounting dashboards include Power BI, Tableau, QuickBooks Advanced Reporting, Smartsheet, and Excel with Power Query extensions. These platforms streamline financial tracking by automating data integration, enabling real-time budget monitoring, and delivering customizable reporting features, with many project-based organizations finding that interactive dashboards enhance decision-making speed and improve cost control accuracy. [Word count: 60]
Real-time data integration enhances project accounting dashboards by providing instant visibility into budget utilization, resource allocation, and financial performance across multiple projects simultaneously. This immediate access enables project managers to identify cost overruns, track milestone progress, and make data-driven adjustments quickly, ultimately delivering improved profitability and stakeholder confidence through enhanced decision-making capabilities.
Visualization transforms complex project financial data into intuitive charts, graphs, and heat maps that enable instant comprehension of budget variances, cost trends, and profitability patterns. Through visual elements like progress bars and color-coded indicators, project managers quickly identify financial risks, track milestone expenditures, and communicate performance insights to stakeholders, ultimately accelerating decision-making and enhancing project oversight.
A project accounting dashboard facilitates budget tracking and variance analysis by providing real-time expense monitoring, automated variance calculations, visual performance indicators, and predictive analytics for cost overruns. Through centralized financial data integration, project managers can identify spending patterns, compare actual versus planned costs, and implement corrective measures proactively, ultimately delivering enhanced financial control and improved project profitability across organizational portfolios.
Common challenges include data integration from multiple systems, ensuring real-time accuracy, user adoption resistance, customization complexity, and establishing consistent reporting standards across departments. While implementation requires significant upfront planning and training investment, organizations in consulting, construction, and professional services find that addressing these hurdles early ultimately delivers enhanced project visibility and streamlined financial oversight.
A project accounting dashboard enhances team collaboration by providing real-time visibility into project costs, budget status, and resource allocation, enabling all stakeholders to access the same financial data simultaneously. Through centralized reporting and automated updates, teams can streamline decision-making, reduce miscommunication about project finances, and coordinate more effectively, ultimately delivering improved project outcomes and accountability.
Essential data sources for project accounting dashboards include financial systems, time tracking platforms, resource management tools, procurement databases, and client billing systems. These integrated sources streamline project oversight by delivering real-time budget visibility, accurate resource allocation tracking, and comprehensive cost analysis, ultimately enabling project managers to make informed decisions and maintain profitability across multiple initiatives.
Dashboard customization addresses diverse stakeholder requirements by enabling role-specific views, personalized metrics, and tailored reporting hierarchies that align with individual responsibilities and decision-making needs. Through configurable widgets and filtering options, executives can focus on strategic KPIs while project managers track operational details, ultimately delivering targeted insights that enhance decision-making efficiency across organizational levels.
Best practices for maintaining project accounting dashboards include establishing regular data validation schedules, implementing automated data feeds, conducting monthly accuracy audits, training team members on updates, and reviewing KPIs quarterly for relevance. These practices ensure dashboards remain reliable through consistent monitoring, real-time integration, and stakeholder feedback loops, with many organizations finding that systematic maintenance delivers enhanced decision-making accuracy and improved project oversight.
Mobile accessibility significantly enhances project accounting dashboard usage by enabling real-time decision-making, improving team collaboration, and increasing data accessibility across field locations. With mobile-optimized dashboards, project managers and stakeholders can monitor budgets, track expenses, and approve costs instantly from construction sites or client meetings, ultimately delivering faster project responses and more agile financial management.
Resource allocation dashboards should prioritize real-time resource utilization tracking, capacity planning tools, skill-based resource matching, budget vs. actual allocation comparisons, and project timeline integration. These features streamline workforce management by enabling managers to identify bottlenecks, optimize team deployment, and balance workloads effectively, ultimately delivering improved project efficiency and strategic resource optimization across multiple initiatives.
Historical project data enhances forecasting accuracy in accounting dashboards by identifying spending patterns, resource utilization trends, and timeline variances across completed projects. Through predictive analytics, organizations can anticipate budget overruns, optimize resource allocation, and improve project delivery timelines, with many finding that data-driven forecasting reduces costs by 15-20% while enhancing strategic planning capabilities.
Essential security measures include multi-factor authentication, role-based access controls, data encryption both in transit and at rest, regular security audits, and automated backup systems. These protocols work together by restricting unauthorized access, protecting data integrity, and ensuring compliance standards, with many financial institutions and consulting firms finding that layered security approaches ultimately deliver both regulatory compliance and client trust.
-
Great product with highly impressive and engaging designs.
-
Easily Editable.