The saying it costs money to make money holds eternally true and no business can hope for longevity, without spending money and maintaining an expense dashboard. Companies aim for profit, but they encounter expenses necessary for survival. Operating a business involves having a dedicated team, influential leaders, business know-how, and, most importantly, a steady flow of funds.
What exactly is an expense?
An expense is the money a company spends on its day-to-day operations to make money. All money spent for business reasons is considered a business expense. Correctly, legally and rationally classifying these expenses is integral to financial functions such as accounting, budgeting, forecasting, and overall expense management.
Explore the Revenue Dashboard's detailed metrics and performance analysis by clicking here.
Expenses Management Using PowerPoint Template
Discover SlideTeam's Top 10 Expenses Dashboard Templates in this blog, where each is crafted to empower financial decision-makers. These templates are robust tools for businesses and individuals, offering a way to track and analyze financial outflows.
The unique feature lies in their adaptability, with 100% customization and editability. The ready-made structure ensures content-ready slides, while the editing capability allows tailoring to specific audience profiles.
To access detailed insights on the Top 7 Operating Expenses, click here.
With these dynamic dashboards, enhance your financial management, budgeting, and overall fiscal responsibility.
Let’s Explore!
Template 1 Accounting dashboard with income and expenses
This professional presentation template gives businesses a powerful tool for monitoring revenue and expenses. The charts and graphs reflect the percentage distribution over a specified period. The template includes metrics such as Income, Cost of Goods Sold, Expenses, Net Profit, Aged Payables (AP), Aged Receivables (AR), QuickBooks Vendor Expenses, and QuickBooks Sales by Product (encompassing product, account, and % sold). Organizations highly value this template for insightful advice and facilitate sharing of information, tailored to meet their needs.
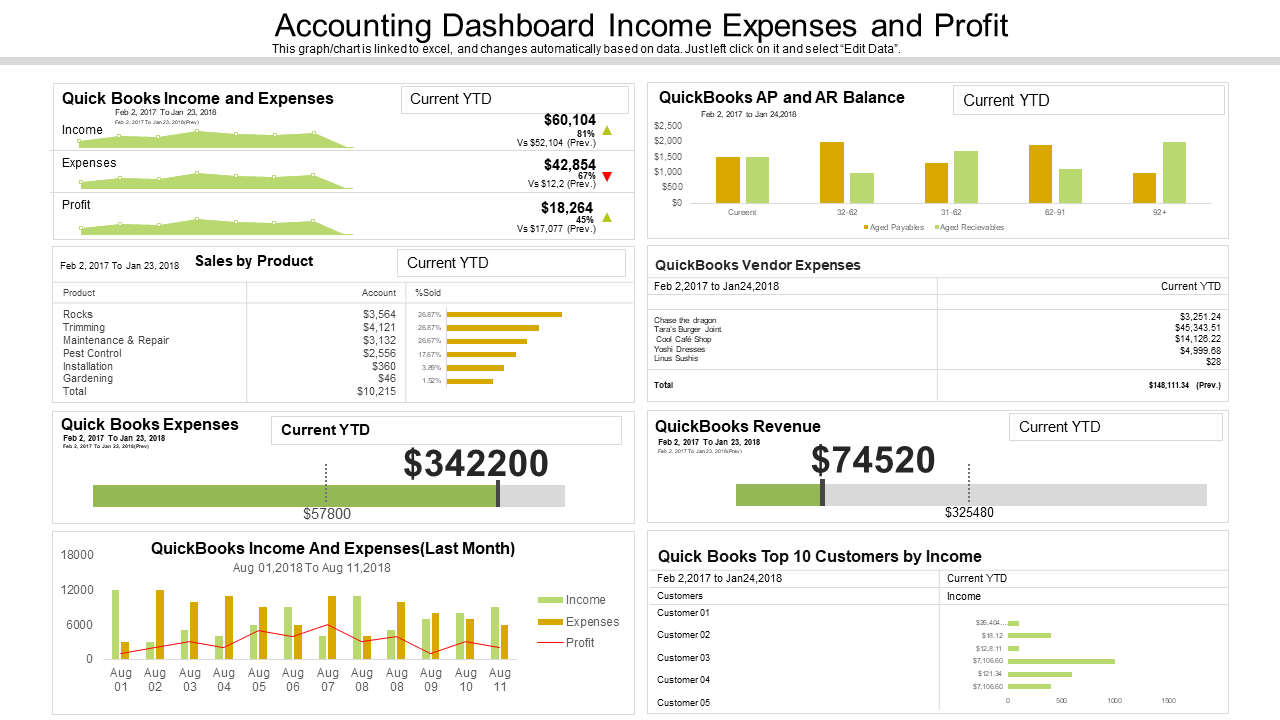
Template 2 Accounting Dashboard Income Expenses and Profit
Use this comprehensive PowerPoint Template for financial management to ensure a clear view of accounts payable and receivables. Sales by Product metrics facilitate a nuanced analysis of revenue streams. The PPT Template integrates key metrics from accounting, bookkeeping, auditing, and finance. This expenses dashboard slide also captures QuickBooks Income and Expenses, offering a detailed breakdown of revenue sources and operational costs. Identify valuable business relationships with QuickBooks' Top 10 Customers by Income, providing a strategic focus on revenue-generating clients.
Template 3 Accounting Dashboard with Executive Summary and Monthly Expenses
Strategically deploying this pre-designed PowerPoint Template aligns your organization's financial and operational goals, integrating budgeting and control. The slide provides a detailed budget view, depicting expenditures and revenues. Key metrics, including the Executive Summary (cash, This Month, Last Month, Variance (%) and Expenses This Month (Advertising, Consulting & Accounting, Freight & Courier, etc.), facilitate thorough financial analysis. Additionally, a chart illustrates income and expenses (last 12 months), deploying elements to convey financial trends. With data visualization, this template empowers your audience to understand and act upon critical information, making it an invaluable tool for strategic decision-making.
Template 4: - Budget Tracking Dashboard with Project Expenses
Use this PowerPoint Template to gain insights into managing your project's budget, ensuring that your project aligns with its objectives. The template employs a dashboard presenting project budget tracking metrics, illustrating monthly expenses related to project activities through charts using Project Expenses and Remaining Budget. It addresses expenses by category and supplier, encompassing team hiring, vehicles (cars, trucks, and tractors), software licenses, HR consulting, and software development. Download this resource to convey your project's financial strategy to your audience.
Template 5 Project Financial Management Dashboard with Revenue and Expenses
Managing a project's finances is crucial for success, extending beyond cost tracking. This PowerPoint Template gives project managers a comprehensive and easily accessible high-level overview of project costs. The PPT includes a dashboard that aids project managers in analyzing profit plans, project profits, total profit, expenses, travel costs, total revenue, wage expense, and travel expenses through clear and readable bar graphs. Additional advantages encompass monitoring progress through financial metrics, prioritizing projects with higher return on investment, and addressing project scope and cost overruns. It enhances resource management by facilitating better allocation aligned with the business's strategic goals. Grab it now!
Template 6 Financial Budget System Dashboard with Income and Expenses PPT Presentation
Step into a new era of financial management with our dynamic and intuitive Budget System Dashboard. Gain control over your financial landscape, as this dashboard integrates income and expenses. Experience real-time insights that empower informed decision-making, allowing you to navigate your financial journey. Simplify budgeting, enhance financial awareness, and make every dollar count. Elevate your financial game today with our template.
Template 7 Data Insight Dashboard Snapshot Including Marketing and Operating Expenses
Use this PowerPoint Template to streamline monitoring of marketing and operational activities. The idea is to learn to make informed decisions for efficient resource allocation. The dashboard encompasses critical metrics, including operating expenses, EBITDA (Earnings Before Interest, Tax, Depreciation, and Amortization), marketing expenses, FTE (full-time employee), and cash flow. The presentation presents these metrics through bar graphs and charts. Seize the opportunity to enhance your decision-making process and download this invaluable template.
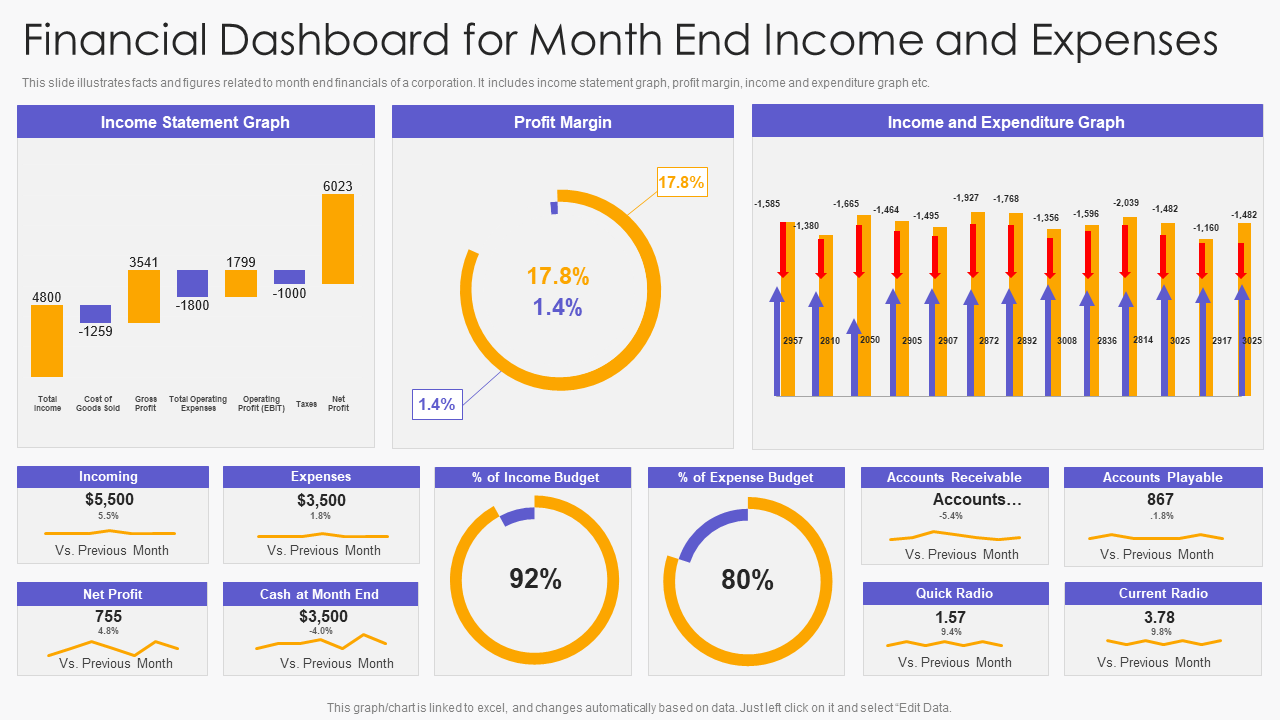
Template 8 Financial Dashboard Snapshot for Month-End Income and Expenses
Use our comprehensive PowerPoint Presentation Template to ensure the accuracy and currency of a business's accounting statements. This template facilitates tracking crucial facts and figures about a corporation's month-end financials. It incorporates income statement graphs, profit margins, and income and expenditure graphs, offering a comprehensive overview of key financial indicators. The presentation covers income, expenses, net profit, cash at the monthly end, accounts receivable, accounts payable, quick ratio, and current ratio, enabling a detailed comparison with the previous month's performance.
Template 9 Project Management Budget and Expenses Portfolio Dashboard
Do you know that when evaluating a project's success, budget is a critical factor? This ready-to-use PowerPoint Template prioritizes the accuracy of the budget rather than just focusing on keeping costs down. It provides information on the spend and the remaining budget, the percentage of the budget still available, and total expenses. This template gives you a unique view of how your projects align with organizational goals and offers support to project managers, enabling them to track and report on budgets in a way that suits their preferences.
Template 10 Dashboard for Organization Expenses Management Organization Budget Forecasting
Last but not the least, this PPT Template proves to be a practical solution for optimizing financial oversight. This PowerPoint Template is embedded in a specialized dashboard to track departmental expenses. What sets this template apart is its ability to furnish essential details about each department's budget allocation, neatly presented through understandable graphs and charts. Users can gain insights into quarterly and yearly total expenses and department-wise allocations, fostering a clear understanding of financial patterns. This presentation equips decision-makers with the information needed for strategic planning and effective decision-making based on a visual breakdown of the organization's expenditure landscape. Grab it now!
Streamline Expense Monitoring Using Templates
Seize the opportunity to leverage these Expense templates and take advantage of their benefits. By documenting all your spending and consolidating other financial data in one centralized place, these templates empower you to analyze and gain a systematic overview of your business's financial standing. Embrace these tools to create a stable financial management system and propel your business toward profitability and success.
PS: For detailed reports on work orders, property status, planned maintenance, and more, explore the insights that our Facility Dashboards provide.


 Customer Reviews


