Accounting dashboard with executive summary and monthly expenses
A budget is a plan that outlines an organization's financial and operational goals. Choose our accounting dashboard with executive summary and monthly expenses PowerPoint template to meet your business requirements. With the help of our accounting dashboard with executive summary and monthly expenses Presentation graphic, you can represent the summary of your monthly expenses in a visually attractive way. Without a budget you may not know how your business is performing. A budget provides an accurate picture of expenditures and revenues and should drive important business decisions. This PowerPoint visual contains the concept of budgeting and controlling which can be used for business related presentations. Our accounting dashboard with executive summary and monthly expenses Presentation slideshow is one of the many types of data visualizations used to organize and present the data in a way your audience can understand and take action on. Edit with an ease and make it your own presentation design.Broadcast your brilliance effectively with our Accounting Dashboard With Executive Summary And Monthly Expenses. They help build consumer confidence.
A budget is a plan that outlines an organization's financial and operational goals. Choose our accounting dashboard with ex..
- Google Slides is a new FREE Presentation software from Google.
- All our content is 100% compatible with Google Slides.
- Just download our designs, and upload them to Google Slides and they will work automatically.
- Amaze your audience with SlideTeam and Google Slides.
-
Want Changes to This PPT Slide? Check out our Presentation Design Services
- WideScreen Aspect ratio is becoming a very popular format. When you download this product, the downloaded ZIP will contain this product in both standard and widescreen format.
-

- Some older products that we have may only be in standard format, but they can easily be converted to widescreen.
- To do this, please open the SlideTeam product in Powerpoint, and go to
- Design ( On the top bar) -> Page Setup -> and select "On-screen Show (16:9)” in the drop down for "Slides Sized for".
- The slide or theme will change to widescreen, and all graphics will adjust automatically. You can similarly convert our content to any other desired screen aspect ratio.
Compatible With Google Slides

Get This In WideScreen
You must be logged in to download this presentation.
PowerPoint presentation slides
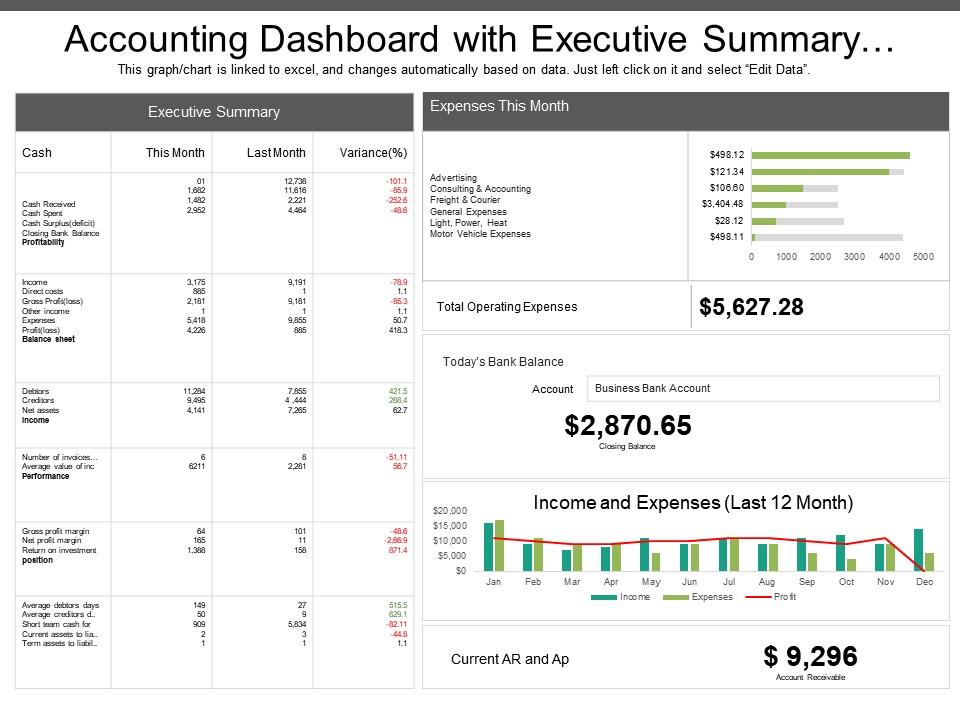
Presenting accounting dashboard with executive summary and monthly expenses PPT slideshow. Makes the information clear in the mind of the audience. Editable visuals, colors and charts. Easy to edit and customize as per your needs. Beneficial for industry professionals, technologists, managers, executives, researchers, sales people, etc. Flexible presentation designs can be presented in standard and widescreen view. Has a futuristic and realistic approach. Privilege of insertion of logo and trademarks for more personalization. Easy to download and save. Highly beneficial PowerPoint Slide for highlighting financial data.
People who downloaded this PowerPoint presentation also viewed the following :
Content of this Powerpoint Presentation
Description:
The image displays an "Accounting Dashboard with Executive Summary," which is an Excel-linked graphical representation of a company's financial data. It shows a comprehensive view of cash position, profitability, expenses, bank balance, and income and expenses over the last 12 months.
Key sections include:
1. Cash Summary:
Comparing 'This Month' and 'Last Month' with variances in cash received, cash spent, cash surplus/deficit, and closing bank balance.
2. Profitability:
A detailed listing of income, direct costs, gross profit/loss, other income, expenses, and balance sheet figures.
3. Expenses This Month:
A bar chart showing categories like advertising, consulting & accounting, freight & courier, etc., with their respective amounts.
4. Total Operating Expenses:
A summarized total expense figure for the current month.
5. Today's Bank Balance:
Shows the closing balance of the business bank account.
6. Income and Expenses (Last 12 Month):
A bar and line chart showing monthly income, expenses, and profit.
7. Current AR and AP:
Accounts Receivable and Payable amounts.
Use Cases:
This dashboard would be invaluable across various industries:
1. Retail:
Use: Financial overview for store performance.
Presenter: Financial Analyst.
Audience: Store Managers.
2. Manufacturing:
Use: Tracking production costs and revenue.
Presenter: Controller.
Audience: Production Heads.
3. Healthcare:
Use: Monitoring patient billing and operational expenses.
Presenter: Chief Financial Officer.
Audience: Department Heads.
4. Technology:
Use: Analyzing project costs versus income.
Presenter: Project Manager.
Audience: Stakeholders.
5. Real Estate:
Use: Managing property sales and maintenance costs.
Presenter: Real Estate Broker.
Audience: Property Investors.
6. Education:
Use: Budgeting for institutional expenses and income.
Presenter: School Treasurer.
Audience: School Board Members.
7. Non-Profit:
Use: Tracking donations and program expenses.
Presenter: Fundraising Manager.
Audience: Board of Directors.
Accounting dashboard with executive summary and monthly expenses with all 6 slides:
Display entrepreneurial expertise with our Accounting Dashboard With Executive Summary And Monthly Expenses. Energize them with exciting thoughts.
No Reviews


