


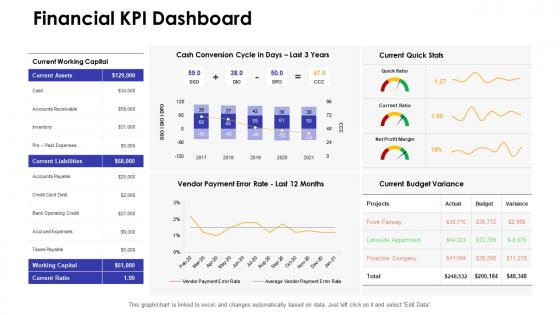
Financial kpi dashboard dashboards by function




Try Before you Buy Download Free Sample Product
 Impress Your
 Audience
 100%
100% Editable
 Save Hours
 of Time


Our Financial Kpi Dashboard Dashboards By Function are topically designed to provide an attractive backdrop to any subject. Use them to look like a presentation pro.
People who downloaded this PowerPoint presentation also viewed the following :
Financial kpi dashboard dashboards by function with all 7 slides:
Use our Financial Kpi Dashboard Dashboards By Function to effectively help you save your valuable time. They are readymade to fit into any presentation structure.





FAQs for Financial kpi dashboard
Revenue growth, profit margins, and cash flow are the big three - they'll show you if things are actually working. Also track customer acquisition cost versus lifetime value, especially when you're scaling up. Burn rate is huge if you're not profitable yet. I literally watched a friend's startup die because they ignored this one. Working capital matters too, plus how fast you're collecting on invoices. Track these monthly minimum, but honestly I check revenue weekly because I'm paranoid like that.
Honestly, just pick 3-5 KPIs that actually connect to what you're trying to achieve strategically. Like if you're expanding into new markets, track customer acquisition cost in those areas - not just random revenue numbers that look pretty on a dashboard. Most teams I know get caught up measuring stuff that doesn't really matter. Monthly reviews work best. Short sentences help too. If your metrics aren't giving you real insights about whether your strategy's working, ditch them and find better ones. It's kinda like using a broken GPS - you'll end up somewhere, but probably not where you wanted to go!
Look, KPIs are just your way of seeing if you're actually hitting your money goals or totally missing the mark. I always tell people to grab maybe 3-5 that really matter - stuff like revenue per customer or cash flow ratios. Use your old data to set realistic targets, then watch how you're doing against them. Honestly, most people pick way too many and get overwhelmed. When you spot trends early, you can tweak your forecasts before everything goes sideways. It's like having a heads up on where your budget's headed instead of just hoping for the best.
Okay so profit margin is basically net profit divided by total revenue, times 100 for the percentage. Like if you made $50k profit on $200k revenue, that's 25%. Pretty simple math. But honestly? It's probably the most important metric you should be watching because it shows how well you're actually turning sales into real money. Low margins usually mean you're either underpricing or your costs are way too high - I'd look at costs first since that's easier to fix. Check it monthly and see how you stack up against others in your industry. If you're consistently behind, something's gotta change.
Dude, it totally depends where you're at. Early stage? Watch your burn rate and runway like a hawk - plus CAC and MRR if you've got revenue flowing. You don't want to be that founder suddenly realizing you're broke next month. Once you're more established, traditional stuff makes sense - profit margins, ROE, debt ratios. Honestly though, most people track way too much. Pick maybe 3-5 metrics that'll actually change how you operate. Pre-revenue? User growth and product engagement. Making money? Unit economics become your best friend. The stage you're in should drive everything else.
Think of KPIs as your company's report card that investors obsess over. Revenue growth, profit margins, cash flow - these show you're not just burning money for fun. Without solid numbers, that Series A becomes a pipe dream. What you track depends on your stage though. Early startups chase growth metrics while established companies worry more about profit margins. Being upfront about your data matters way more than having perfect numbers. Pick 3-5 KPIs your investors actually care about and show you're trending upward. Consistency beats perfection every time.
Depends what you're working with budget-wise, but Excel's honestly still your best bet for smaller teams. Everyone already knows how to use it and you can get pretty creative with dashboards. Power BI and Tableau are solid if you want something fancier with automation - way better for interactive stuff. QuickBooks or Xero work fine for basic tracking too. But here's the thing - I've watched so many companies get stuck in analysis paralysis for months trying to find the "perfect" solution. Just pick whatever your team will actually stick with. That matters more than bells and whistles.
So liquidity ratios are basically how you figure out if your business can actually pay its bills without panicking. Current ratio and quick ratio are the main ones to watch. Low ratios? You're gonna have cash flow headaches and banks will probably give you the side-eye when you need loans. But honestly, super high ratios aren't great either - means you're hoarding cash instead of investing it back into growth. I'd use these to catch potential money problems before they hit. They're also helpful for deciding stuff like inventory levels and payment terms with customers.
ROI shows how much profit you make per dollar invested - your classic "bang for buck" thing. What's cool is you can compare totally different projects with it. That $10K project earning 50%? Way better than some $100K one only hitting 20%. Everyone gets ROI too - doesn't matter if you're talking to your boss or investors. Just don't mix up how you calculate it between projects or you'll get weird numbers that don't make sense. Honestly, it's probably the easiest way to figure out what's actually worth your time and money.
Here's the thing - your KPIs will show you exactly where stuff's falling apart. Gross margins dropping? That's usually cost control or pricing gone wrong. Check your operating expense ratios too, they'll catch overspending fast. DSO is honestly my favorite metric because it spots collection issues that kill your cash flow. Low inventory turnover screams dead stock or crappy forecasting (been there). I'd compare everything to your past numbers first, then see how you stack up against competitors. Once you find the worst areas, that's where you dig deeper.
Dude, sustainability metrics are becoming just as crucial as the usual financial stuff - ESG reporting isn't optional anymore. Customer lifetime value and recurring revenue models? They're everywhere now, especially with all these subscription businesses. Real-time KPIs are the new normal because waiting three months for data is honestly ridiculous in 2024. AI-driven predictive metrics are getting big too - they'll forecast your cash flow and spot problems before they wreck your P&L. My advice? Start playing around with this stuff now instead of panicking later when investors expect it as baseline reporting. Trust me on this one.
Here's the thing - financial KPIs are basically rearview mirrors. Sure, your revenue looks solid, but what if customers actually hate you right now? That's gonna bite you next quarter. I've seen companies obsess over the numbers while completely ignoring stuff like employee morale or brand perception. Those things actually drive future results, you know? Short-term thinking becomes this trap when you're only watching financials. Mix in some forward-looking metrics instead - customer retention, pipeline health, even team turnover rates. They'll tell you what's coming before it hits your bottom line.
Look, KPIs are basically your BS detector for pricing and product stuff. Gross margins tanking? Time to raise prices or slash costs - pretty obvious when you see the numbers. Customer acquisition cost vs lifetime value shows how much you can blow on getting new customers without going broke. Super useful for pricing features too. Churn rates and revenue per user? That's where you figure out which products are actually worth your time. I swear, so many teams get obsessed with cool features while completely ignoring whether they're making money. Just start with margin analysis by product - you'll spot pricing issues right away.
First thing - know your audience. Executives want the big picture trends, but your ops team needs details they can actually do something with. Dashboards and charts are your friend here because honestly, who has time to stare at spreadsheet rows? Always give context too - compare to last quarter or your targets so people know if you're crushing it or not. Set up regular reporting so everyone knows what's coming when. Oh, and don't just throw numbers at people. Tell them what it means and what they should do next.
Quarterly reviews work for most businesses, but honestly? If you're moving fast, check them monthly. Your KPIs from last year might be completely useless now - I've seen companies track vanity metrics for way too long. Set calendar reminders to ask yourself: do these actually measure what drives our success today? Market conditions shift, you pivot, expand into new stuff. Don't get attached to old metrics just because you've always used them. Drop what's not working and add new ones that match where you're heading. Oh, and make it a real audit - not just a quick glance.
-
Very unique and reliable designs.
-
Excellent work done on template design and graphics.
-
Nice and innovative design.