


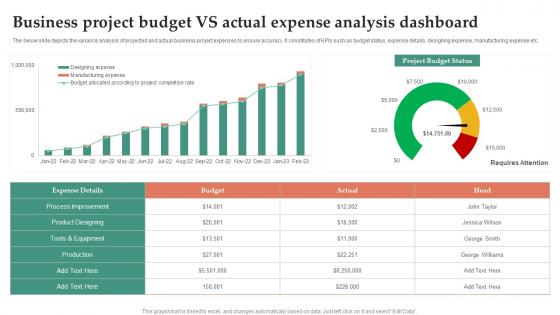
Business Project Budget Vs Actual Expense Analysis Dashboard




Try Before you Buy Download Free Sample Product
 Impress Your
 Audience
 100%
100% Editable
 Save Hours
 of Time


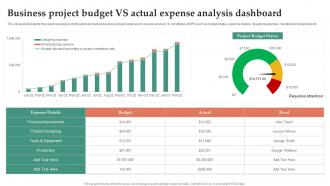
The below slide depicts the variance analysis of projected and actual business project expenses to ensure accuracy. It constitutes of KPIs such as budget status, expense details, designing expense, manufacturing expense etc.
People who downloaded this PowerPoint presentation also viewed the following :
Business Project Budget Vs Actual Expense Analysis Dashboard with all 7 slides:
Use our Business Project Budget Vs Actual Expense Analysis Dashboard to effectively help you save your valuable time. They are readymade to fit into any presentation structure.





FAQs for Business Project Budget Vs Actual
You'll need budgeted vs actual amounts, then calculate the variances and percentages. Break everything down by revenue and expenses - maybe by department too if that makes sense for your company. Honestly, the percentage variances tell a better story than raw dollar amounts since they show the real impact. Always write up explanations for the big variances because your boss will definitely ask about them anyway. Oh, and make sure your time periods match up consistently - learned that one the hard way. Focus your narrative on unfavorable variances especially.
Set up a monthly dashboard showing budget vs actual for each line item - I flag anything over 10% as worth investigating. Rolling 3-month averages work way better than month-to-month comparisons since random stuff always throws things off (like that time we had to replace the entire HVAC system). Focus on your top 5 expense categories first. Don't try tracking everything at once or you'll burn out. Track both good and bad variances consistently. Your reports need to be simple enough that everyone can understand them. Some months will just be weird - that's normal.
Honestly, Excel's probably your best bet to start with - yeah the formulas can be a pain but it's way more powerful than people give it credit for. QuickBooks, Xero, or FreshBooks are solid if you want something that handles reporting without the headache. Power BI and Tableau make those flashy dashboards that impress everyone in meetings (learned that one the hard way). For bigger stuff, maybe look at Adaptive Insights or Prophix, though that's getting pretty fancy. Really depends on your budget and how complex you're trying to get. I'd just use what you've already got access to first.
Think of budget vs actual like your financial radar - it catches problems before they blow up. Honestly, I've watched teams spot profit issues months ahead just by tracking these variances regularly. Don't get hung up on single-month weirdness though, that stuff happens. Focus on the trends instead. When you see something off, dig into why it's happening - that's where you'll find the good stuff. Maybe you need to shift resources around or tweak pricing. The whole point is catching things while you can still do something about it, you know?
Timing screws people up constantly - don't compare Q1 numbers to your full-year budget like an idiot. Seasonal stuff matters too. Look, I've seen people waste hours obsessing over a $50 variance on massive budget lines. Focus on what actually moves the needle first. Dig into WHY variances happened instead of just flagging them. Make sure you're comparing the same periods and categories (sounds obvious but you'd be surprised). Oh, and write down your assumptions - future you will thank you when someone asks how you got those numbers three months later.
Honestly, visual templates are a game changer for budget stuff - way better than staring at endless spreadsheet rows. Waterfall charts show you exactly where things went sideways. Traffic light dashboards are clutch too, red flags pop right out. Heat maps across departments? *Chef's kiss* - you'll spot patterns instantly. People just absorb visual info faster than number-hunting through cells. Plus templates keep your format consistent, so everyone knows where to look each month. I'd start simple with bar charts doing budget vs actual, then get fancy once people aren't intimidated by it. Though honestly, sometimes the fancier charts confuse more than they help.
Only worry about variances above 5-10% - anything smaller is just noise. Start with the big picture summary, then get into specifics. Charts work way better than spreadsheets because people's eyes glaze over with too many numbers. Come ready with why things went sideways AND what you're gonna do about it. Nobody wants just problems dumped on them. I always structure it like: here's our current status, here's what screwed us up, here's the fix. Oh, and if you can tie it back to something they actually care about (like hitting quarterly goals), even better.
Okay so industry standards are basically your reality check for budgets. Most sectors have pretty established ranges for what's considered normal variance - construction usually sees 5-10% cost overruns, but tech projects? Those can go completely off the rails lol. Research what's typical in your industry first, then bake those patterns into your budget assumptions upfront. That way when you're sitting there 8% over budget, you'll actually know whether to panic or just shrug it off. Way better than flying blind and freaking out over stuff that might just be par for the course.
When you compare what you actually spent to what you budgeted, you start seeing patterns that make your next forecast way better. Like, you'll notice certain expenses always go over (marketing, I'm looking at you), or how winter months mess with your numbers. Honestly, it's pretty eye-opening once you track this stuff for a few cycles. Look at the differences over several months - not just one bad month - and you'll catch the real trends. Then just bake those lessons into your next budget. Way more reliable than guessing what might happen.
Monthly budget reviews are your best bet. Weekly feels like way too much work unless your business is super unpredictable or you're in crunch mode. Quarterly? You'll catch problems way too late. Monthly hits that sweet spot where you get real patterns in your data but can still fix stuff before it tanks your profits. Honestly, most businesses overthink this - start monthly and see how it goes. If things get crazy volatile later, bump it up to weekly. But don't make extra work for yourself right off the bat.
Honestly, you can't track budgets accurately without your whole team talking to each other regularly. People need to actually share what they're spending and flag issues before they blow up - I've watched so many budgets crash because everyone just did their own thing in isolation. Set up weekly check-ins where you all go through the numbers together. When someone spots a potential overrun or has unexpected expenses coming up, they can mention it right away. It sounds basic but those regular touchpoints are what keep everything from falling apart later.
Don't wait for monthly meetings to drop variance bombs - been there, done that, it sucks for everyone. Jump on discrepancies immediately. Sure, start with the numbers but honestly? People care way more about WHY stuff went sideways and what you're gonna do about it. Dashboards are your friend here since spotting trends becomes super obvious. Oh and never show up empty-handed - always bring solutions. Even if it's just "give us two weeks to figure this mess out," that's still better than shrugging your shoulders.
You need historical data to make sense of your budget vs actual numbers - otherwise you're flying blind. Like, seeing a 30% drop might freak you out until you realize it happens every January after holiday sales tank. I always pull at least 2-3 years of history to spot what's normal seasonal stuff versus actual problems. Sometimes variances look scary but they're just part of your business cycle. Historical context helps you figure out if you should actually worry or if it's just Tuesday being Tuesday, you know?
Honestly, the real trick is figuring out WHY you're off budget, not just that you are. Like, are you always blowing money on the same stuff? Missing revenue targets in specific areas? That's where the good stuff is. I've watched so many people get stuck staring at spreadsheets instead of actually doing something about it. Pick your worst 3 variances and make actual plans to fix them. Don't just review monthly - talk about this stuff regularly. Oh, and definitely look for patterns over time. Those tell you way more than one-off numbers ever will.
So basically, fixed budget analysis just takes your original budget and compares it straight to what actually happened - doesn't matter if you made way more or less stuff than planned. Flexible budgeting is smarter though. It recalculates what you *should've* spent based on your actual production first, then does the comparison. Like if you budgeted for 1,000 units but made 1,200, it figures out the "right" budget for 1,200 units before looking at variances. Way better for spotting real problems vs just volume differences. I'd go flexible if you've got variable costs - manufacturing, labor, that kind of stuff.
-
I want to express my gratitude to SlideTeam’s presentation design services team for helping me create the best presentation of my life!
-
What an exhaustive collection of templates you guys have there in slideteam. Impressive!!!