


 0 Comment
 Customer Reviews

Think back to your school days. Remember that feeling when you got your report card? It didn’t just show your marks, it silently told a story. There was a comparison of your grades with the minimum passing marks, telling exactly where to step up, right? A variance dashboard works just like that, but it deals with projects, budgets, timelines, and outcomes. It gives any business a side-by-side view of what was planned and what actually happened and picks out areas that need improvement.
Here’s stats dashboard to learn more on how you can effectively utilise your data.
Just like a report card helps students and teachers make better decisions, variance reporting gives leaders and teams clarity on your deliverables. Losing sight on gaps or variance may land you in big loss. This dashboard makes the invisible visible. It doesn’t just show you the numbers; it shows you what they mean. It brings in real-time comparisons, visual alerts, and insights you can act on with no more guesswork, no more digging through spreadsheets.
Now here’s where a ready-made presentation comes in. If you’re a team lead, consultant, analyst, or someone trying to explain the value of tracking performance, this is your shortcut. This blog provides you with everything you need- from variance analysis, financial dashboard, data visualization, performance metrics, business intelligence, KPI dashboard, reporting tools, etc.
Check out the list of our ten leading analytics dashboards presentation templates here.
Let’s explore!
Template 1: Sales Transaction Summary Dashboard with Variance Analysis
This is a ready-made template that helps you understand how your sales are tracking against your goals, where your revenue is coming from, and where intervention is needed at a single glance. It’s like your monthly report card, where bar graphs explain your way forward and percentages tell where change is happening. Every block and every color in this template helps to keep your team focused, fast, and on target. And it’s not just for analysts. It’s for decision-makers who don’t have time to dig. For sales leads who need answers, not assumptions. For marketers, planners, and finance teams who want to show results and explain why. This is the dashboard that not only reports data but also makes your story sensible.

Template 2: Actual VS Target Sales Variance Dashboard
Here is a PPT preset that helps you understand whether the expectations have been met by reality or not! The Actual vs. Target Sales Variance Dashboard is crucial as it unfolds the nuances behind your sales figures that not only help you understand how your sales performed but also explain why. It includes everything from sales variance to specific breakdowns like price, mix, and quality variances in a visually better manner. If you want to explain to your leaders or stakeholders why the numbers went down, then use this slide for that. This dashboard is ideal for sales managers, operations leads, and finance teams who need to prepare such presentations very often.

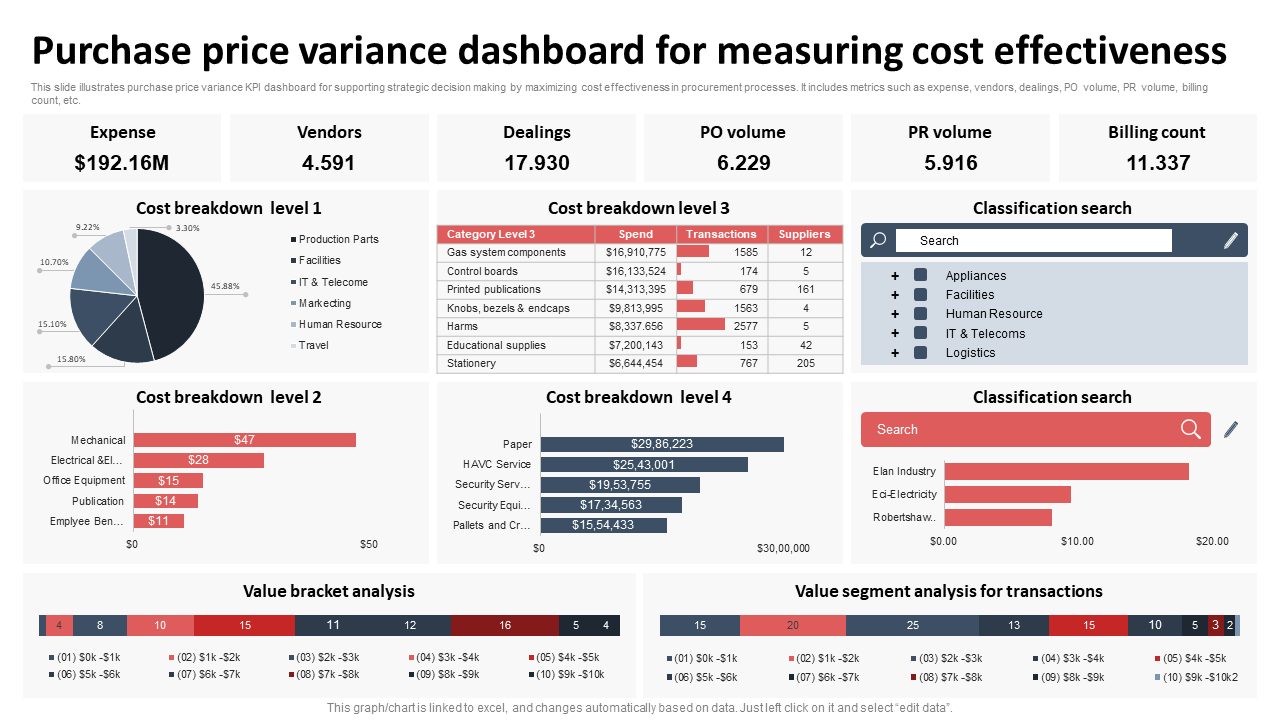
Template 3: Purchase Price Variance Dashboard for Measuring Cost Effectiveness
Sometimes, it isn't easy to guess where the money is going in procurement. But this slide can solve that problem. This PPT layout wipes out blind spots associated with money spent on various things in business. It acts as a personal guide to business owners or managers in sales and marketing with respect to smarter and better spending. This dashboard covers everything from total expenses to every single vendor and purchase order, making it easy to spot where businesses can save big, whether it's on IT or office supplies. Plus, you can filter by department to pinpoint exact variances. Use this slide to negotiate like a pro, boost efficiency, and turn every rupee into a smart investment.
Template 4: Variance Analysis Dashboard for Budget Compliance
This slide helps you understand where every penny goes! It's all about making your budget planning smarter and finding out those chances to add real value. These days, spreadsheets are turning tedious, and instead, these super-friendly slides are turning more helpful as they lay out the department's spending side-by-side with what is planned, at a single glance. It helps you understand how good the business has been compared to the previous year and gives you guidance on managing the income and spending flow every month. Whether it's payroll or that new marketing campaign, this dashboard is all you need to see the difference.

Template 5: Financial Planning Analytical Dashboard with Revenue Variance
This template acts as a financial control tower for you with a real-time view of your year-to-date (YTD) revenue and how close you are to your target. This dashboard helps you enhance your financial performance with no guesswork. It helps you find out revenue gaps, see how each month stacks up, and analyse trends that matter. And the graphs help you notice what happened to your finances in a given month or a year, and clear your path to think about what to do next. The 'Revenue Detail' table compares your goals vs. actuals across key months so you can track progress and pivot with confidence. Download now!

Template 6: Construction Project Budget Variance and KPI Monitoring Dashboard
This dashboard is built for people who manage construction in the real world. Think of it as your daily check-in, which gives you visibility into where each project stands - whether it is in a planning stage, procurement stage, or whether it has started or completed. It also helps you track progress against your daily target, spot budget variances before they spiral, and adjust course without the last-minute panic. Need to reallocate resources or rebalance a stretched team? One look at the task breakdown — completed, overdue, and pending — and you’ll know exactly where the gaps are. Download now!

Template 7: Financial Planning and Analysis Dashboard with Revenue Variance
Trying to keep track of revenue goals, actuals, and what went wrong or right in between? That’s where this dashboard comes in. The 'Revenue Details' table lays out target vs. actual income, month by month, with real percentage outcomes. And the 'Revenue Variance' chart shows you what’s driving change across critical accounts like S&M, G&A, and CoS-Sup. This dashboard helps to track any progress in financial goals and make informed, data-driven decisions when it comes to spending, allocating resources, etc. It also helps in saving time by juggling spreadsheets and eliminates guesswork. If you want to get an edge over your financial reporting and planning, download this slide now!

Template 8: Business Dashboard Slide for Homogeneity Variance Assumption
Are your operations truly consistent across the board? This dashboard shows you the story behind the numbers. From shipping to final delivery, each stage is set out clearly so you can track the flow, spot difficulties, and stay in control. It’s designed to bring structure to discrepant variance data, making it easy to see whether your processes are aligned or not. Whether you're looking at totals year-to-date, rolling performance, or daily metrics that need to be prioritised right now, this slide has them for you. The donut chart breaks down your process touchpoints, while red and green indicators make progress and bottlenecks impossible to miss.

Template 9: Ecommerce KPIs Dashboard Exhibiting Sales Target and Variance
Tired of working on spreadsheets and digging through disconnected reports? Then, this ecommerce KPI dashboard is all you need to relax. It pulls together your key performance metrics into an easy-to-view format. It tells you exactly how you're tracking sales, orders, customer visits, cart abandonment, etc, and also explains why it matters. All the jumps you see in total orders or conversion rate, this dashboard clearly specifies them with visually appealing status icons. Designed for ecommerce leads, growth teams, and digital strategists, this slide gives your data a voice, so you can take action and tell a clearer performance story to your managers and stakeholders. Download now!

Template 10: Quarterly Cost Variance Analysis with Maintenance KPI Dashboard
In environments where efficiency and cost optimization are important, this slide acts as an essential tool and helps in informed, data-driven decision-making. It provides a quarterly maintenance performance view with financial variance, scrap rates, and run time metrics - all at a glance. Rather than searching for the root cause, the dashboard guides your focus, showing actual versus budgeted spend, total production, and a scrap percentage. This dashboard is useful for operations leaders, finance teams, and plant managers as it enables early intervention, budget accuracy, and continuous improvement by helping turn raw data insights into useful strategy.

Over to you!
By now, you would have understood the importance of having ready-made dashboards on data analytics, trend analysis, budget variance, and other crucial aspects of variance reporting. Now, it’s your turn to make the most out of our ready-made 100% editable and customizable templates in this blog. They have all the graphs, charts, and nuances needed for your business.
PS: Explore SlideTeam's collection of insight dashboard PPT Templates and add value to your business by creating or improving it.
FAQs on Variance Dashboard:
1. How does a variance dashboard help in monitoring performance against targets?
A variance dashboard visually compares actual results to targets or forecasts, making deviations easy to identify. This allows teams to take corrective action quickly and keep projects or financials on track.
2. What types of variances can be tracked (e.g., budget vs. actual, forecast vs. actual)?
Dashboards can track budget vs. actual, forecast vs. actual, plan vs. performance, and time vs. cost variances. These insights help evaluate financial efficiency, operational consistency, and strategic alignment.
3. What key metrics and KPIs should be included in a variance dashboard?
Important KPIs include revenue, expenses, conversion rates, production output, and run-time or cost variances. Including target vs. actual percentages and trend indicators enhances decision-making accuracy.