

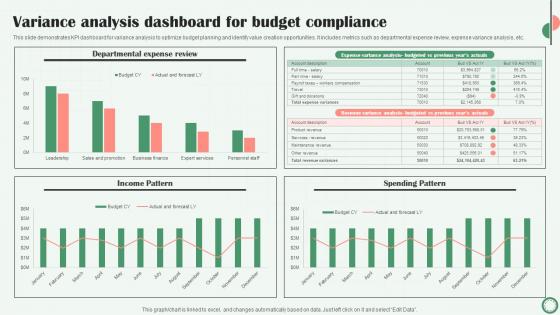
Variance Analysis Dashboard For Budget Compliance




Try Before you Buy Download Free Sample Product
 Impress Your
 Audience
 100%
100% Editable
 Save Hours
 of Time


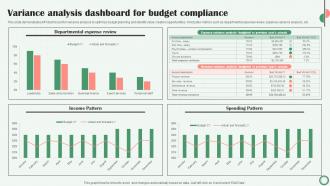
This slide demonstrates KPI dashboard for variance analysis to optimize budget planning and identify value creation opportunities. It includes metrics such as departmental expense review, expense variance analysis, etc.
People who downloaded this PowerPoint presentation also viewed the following :
Variance Analysis Dashboard For Budget Compliance with all 10 slides:
Use our Variance Analysis Dashboard For Budget Compliance to effectively help you save your valuable time. They are readymade to fit into any presentation structure.








FAQs for Variance Analysis Dashboard
So you're mainly dealing with three types: budget vs actual, price variances, and volume variances. Basically you compare what you planned against reality, then figure out why things went sideways. Price variances tell you if materials or labor cost more/less than expected. Volume ones show whether you made more or less stuff than planned - honestly those are kind of a pain to wrap your head around at first. Don't just look at good or bad variances in isolation though. Calculate your total variance first, then break it down to find what actually matters. That's where the useful stuff usually hides.
Look, variance analysis is just comparing what you budgeted vs what actually happened - then using those gaps to make better forecasts. So if your marketing always goes 15% over budget or Q3 sales tank every year, you'll catch those patterns. Honestly, most people skip this step and wonder why their budgets suck. Track your biggest misses each month, then bake those insights into next year's plan. It's like learning from your mistakes instead of repeating them over and over.
Flexible budget method is probably your best bet - just compare what actually happened against what your budget should've been at that activity level. Standard costing is another route where you break things down into price vs quantity variances, which honestly makes finding the real problems way easier. Some people swear by three-way analysis for overhead stuff (spending, efficiency, volume). Really depends on what data you can actually get your hands on and how deep you need to dig into the numbers.
Don't just dump numbers on people - tell them what's actually happening. Start with your biggest variances and explain why they happened, then (this is key) what you're gonna do about it. Honestly, those massive spreadsheets are useless - everyone just glazes over. Use visuals instead. Break everything down so each department only sees their stuff. Keep it simple and tie it back to real money. Like "we're 15% over on labor costs, that's $50K we didn't plan for, but here's how we fix it." Numbers mean nothing without context.
Look, when your budget keeps showing bad variances, that's basically your numbers screaming something's broken. Maybe your pricing assumptions were too optimistic, or costs spiraled more than you thought. Either way, you can't just ignore it and hope things improve. These red flags might mean pivoting your product focus, finding cheaper suppliers, or honestly just hitting pause on that expansion you were planning. I learned this the hard way once - kept pushing forward despite terrible variances and ended up in a much worse spot. Dig into what's actually causing the mess before you make any big moves.
Honestly, the tech handles most of this stuff automatically now. It pulls data straight from your ERP, calculates variances instantly, and alerts you when things go off track. Way better than those nightmare spreadsheets we used to deal with! You can drill down to see exactly what's causing issues - materials, labor, overhead, whatever. Some of the AI tools even predict problems before they hit (which is kinda wild). I'd set up dashboards that ping you immediately when variances cross your limits. That way you're fixing stuff right away instead of finding out weeks later when it's too late.
Yeah, definitely! Any metric where you've got a target works. Customer satisfaction, turnover rates, cycle times, conversion rates - whatever you're measuring. Same process as financial stuff. Take actual vs budget, figure out why they're different. Volume issue? Efficiency problem? Something weird happening? Honestly, I like these non-financial ones better sometimes. They catch problems before your financials go sideways. Just pick something you're already tracking and do a quick actual vs target breakdown. Don't overthink it - you'll spot patterns pretty fast once you start looking.
So basically, you compare what you actually spent vs what you planned to spend - that's variance analysis. When material costs jump way up or your deliveries start taking forever, the numbers will show it right away. I usually tell people to break it down by price, quantity, and efficiency so you're not just staring at one big scary number. Set up reports for your main supply chain stuff and dig into anything that's off by more than 5-10%. Honestly, it's probably the fastest way to catch problems before they get worse.
Honestly, the biggest mistake is chasing tiny variances when you should focus on what actually moves the needle. Don't use old standards - that's just setting yourself up for confusion. Set materiality thresholds right away or you'll end up analyzing $50 differences on million-dollar budgets (been there, it's brutal). Timing differences mess people up constantly. One-off events too. You can't just look at variances in a vacuum without considering what caused them. Short version: figure out your materiality limits first, then only dig into the stuff that'll actually help you make better decisions. Everything else is just noise.
Honestly, monthly is the bare minimum you should be doing variance analysis. Weekly's even better if your business moves fast. Don't be like those companies that wait until quarterly reviews - by then you're basically performing an autopsy on your budget instead of actually fixing problems. The real trick is staying consistent with whatever schedule you pick. How volatile is your business? That matters more than you'd think. Start monthly and see if you're catching stuff too late. If problems keep slipping through, bump it up to weekly. I've watched too many teams wonder why they missed targets by a mile when they only checked numbers every three months.
So static budget variance just takes your actual results and compares them to the original budget - pretty basic stuff. But flexible budget variance? Way better. It adjusts your budget based on what actually happened first. Like if you planned for 100 units but made 120, it recalculates what you should've spent at 120 units, then compares. This splits out volume issues from your actual cost control problems. Honestly, I always go with flexible budgets because they show you how well you managed costs at your real activity level. Makes the whole analysis cleaner.
Honestly, I'd start with your biggest variances and work backwards from there. Trend analysis helps you see patterns developing over time, which is clutch. Then throw in some ratio analysis to actually understand what's driving those numbers. Root cause analysis is key too - variance tells you *what* went wrong but not *why*, you know? I always connect it to forecasting models since that helps predict future issues before they hit. Dashboard tools like Tableau make everything way easier to visualize alongside your KPIs. The goal is building a complete picture for whoever's asking - they'll thank you for doing the detective work upfront.
Look, you gotta dig into what's actually causing those big variances or you'll just keep dealing with the same mess every quarter. I learned this the hard way - surface-level fixes don't stick. Maybe it's your suppliers screwing up delivery schedules, or someone set totally unrealistic budget targets from the start. Once you figure out the real problem, you can actually fix it instead of just putting band-aids on everything. Your forecasts get better too since you understand what's really driving the numbers. Try asking "why" three times for each major variance - sounds simple but it works.
So variance analysis is basically comparing what actually happened vs what you budgeted for. Pretty straightforward stuff. You look at the gaps and figure out why they happened - was it market conditions, team performance, whatever. I've found it's way better to do these reviews monthly instead of waiting until the end of the quarter when it's too late to fix anything. The whole point is catching problems early so you can shift resources around or help struggling team members before things get messy. It's honestly saved my butt more times than I can count.
Start with the money basics - budgets, forecasts, how to actually read financial statements. Excel is honestly where you'll live, so get comfortable there. Your team needs to spot the difference between what was planned vs what actually happened. I'd have them shadow someone experienced for a few cycles first, that's huge. Statistical stuff helps for catching trends and weird outliers. Don't forget the company-specific training though - your budgeting process, reporting systems, all that internal stuff. Oh and understanding what really drives your business numbers. Build it up gradually from there.
-
The designs are very attractive and easy to edit. Looking forward to downloading more of your PowerPoint Presentations.
-
Very unique, user-friendly presentation interface.