

Budget Vs Actual Variance Analysis Powerpoint Presentation Slides





Try Before you Buy Download Free Sample Product
 Impress Your
Audience
 100%
Editable
 Save Hours
of Time


Plan, analyze and manage business budgets with our content ready Budget Vs Actual Variance Analysis PowerPoint Presentation Slides. The variance analysis in cost accounting PowerPoint complete deck comprises of self-explanatory templates such as actual cost vs budget, month-wise forecasting, overhead cost analysis, quarterly budget analysis, variance analysis, actual vs target variance, budget vs plan vs forecast, forecast, and projection, etc. Interpret the reason for variance of actual outcomes against forecasted behavior in finance using the professionally designed budget projection PowerPoint presentation. Make use of this interactive finance budgeting PPT presentation to visualize your budget data and statistics. Utilize the visually appealing financial forecasting PowerPoint templates to establish periodic reviews of actual expenses as compared to the budget. Furthermore, budget variance analysis PowerPoint presentation can help you to identify potential cost overruns and revenue shortfalls. Download the high-quality actual vs budget variance PPT visuals to determine the difference between projected revenues and expenditures. Our Budget Vs Actual Variance Analysis Powerpoint Presentation Slides don't allow the going to get heavy. They bring in an element of fun.
People who downloaded this PowerPoint presentation also viewed the following :
Content of this Powerpoint Presentation
Slide 1: This slide introduces Budget vs Actual Variance Analysis. State Your Company Name and begin.
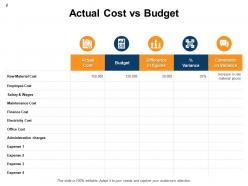
Slide 2: This slide shows Actual Cost vs Budget in tabular form.
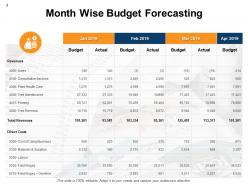
Slide 3: This slide presents Month Wise Budget Forecasting.
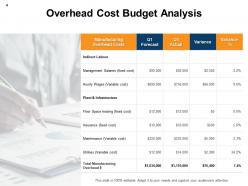
Slide 4: This slide displays Overhead Cost Budget Analysis.
Slide 5: This slide represents Quarterly Budget Analysis in tabular form.
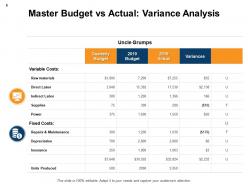
Slide 6: This slide showcases Master Budget vs Actual: Variance Analysis with variable and fixed costs.
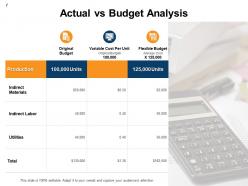
Slide 7: This slide shows Actual vs Budget Analysis with categories as original budget, variable cost per unit and flexible budget.
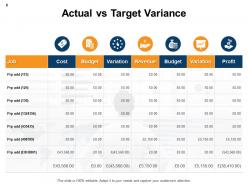
Slide 8: This slide presents Actual vs Target Variance.
Slide 9: This slide displays Budget vs Plan vs Forecast. You can add data as per requirements.
Slide 10: This slide represents Forecast vs Actual Budget.
Slide 11: This slide showcases Forecast and Projection on monthly basis.
Slide 12: This slide shows Budget vs Forecast vs Actual.
Slide 13: This slide displays icons for Budget vs Actual Variance Analysis.
Slide 14: This slide is titled as Additional Slides for moving forward.
Slide 15: This slide shows Scatter Chart with two products comparison.
Slide 16: This slide displays Clustered Bar Chart. You can change data as per requirements.
Slide 17: This is Our Goal slide. Show your firm's goals here.
Slide 18: This slide is titled as Post It Notes. Post your important notes here.
Slide 19: This is a Venn slide with text boxes to show information.
Slide 20: This is a Thank You slide with address, contact numbers and email address.
Budget Vs Actual Variance Analysis Powerpoint Presentation Slides with all 20 slides:
Use our Budget Vs Actual Variance Analysis Powerpoint Presentation Slides to effectively help you save your valuable time. They are readymade to fit into any presentation structure.




FAQs for Budget Vs Actual Variance Analysis
So variance analysis is just tracking what you budgeted vs what actually went down, then digging into why things are off. Honestly, it sounds mind-numbing but it's clutch for catching stuff early. Like maybe your supplier jacked up prices or one sales territory is totally bombing. I'd focus on your biggest expenses first - track those monthly. You'll spot problems before they spiral and figure out what's actually working. My old boss was obsessed with this stuff and it saved us from some real headaches.
So fixed costs are pretty straightforward - they don't change with activity, so variances are just "did we spend more or less than planned?" Variable costs though? Way more annoying. You've got to separate two things: efficiency variances (using more/less resources than expected) and spending variances (paying different rates). Oh, and here's what trips everyone up - you HAVE to flex your budget to actual volume first when looking at variable costs. Otherwise you're basically comparing random numbers and wondering why nothing makes sense. Trust me on that one.
You need standard quantities, prices, and costs for both materials and labor - basically your "here's what we planned" numbers. Break down your overhead rates into variable and fixed parts too. Without these baselines, you can't figure out what actually went sideways later. Expected activity levels matter a ton since overhead variances are super volume-dependent. Oh, and don't forget to update these standards regularly or you'll be stuck comparing today's performance to last year's outdated expectations, which honestly just creates more confusion than help.
Look, variance analysis is basically your reality check - it shows where actual numbers went off the rails compared to your plan. Super helpful for figuring out if teams are killing it or totally missing the mark. Think of it like... I dunno, comparing your GPS route to where you actually ended up driving? You can separate what managers actually controlled from random stuff that just happened to them. Honestly, I'd start with the biggest differences first since those usually matter most. Small variances are often just noise anyway. It's pretty solid for spotting both wins and problem areas fast.
Okay so basically - favorable variances mean you did better than expected. Like you spent less or made more money than your budget said you would. Unfavorable is when you went over budget or came up short on revenue. Here's the thing though - "unfavorable" doesn't automatically mean you screwed up. Maybe you spent more because sales were crushing it and you needed extra inventory. I learned this the hard way at my old job lol. Both types need a closer look to figure out what actually happened. Don't just celebrate the good ones and freak out over the bad ones.
Honestly, variance analysis is pretty clutch for figuring out where your business is actually going wrong. Like when labor costs keep blowing past your budget every month - that's screaming "get some automation or better training." Your biggest variances? Start there first. Budgets are educated guesses anyway, but tracking these patterns over time shows you which problems need major strategic fixes versus just small operational adjustments. Sometimes you'll realize your whole assumptions about certain areas were way off. Use that intel to tweak your long-term planning and decide where to throw your resources next.
So variance analysis is just comparing what actually happened vs what you thought would happen. Then you figure out why stuff went sideways. Like if your sales keep beating forecasts by 15% or labor costs always jump in Q3 - that's super useful intel. Honestly, most people skip this step but it's where the real learning happens. Those gaps tell you which assumptions were off base. I'd say pick your biggest 3-5 variances each month and work those patterns back into your next forecast. Makes a huge difference.
Yeah, external stuff totally messes with variance analysis - market changes, new regulations, economic weirdness. Your numbers might look terrible compared to budget, but it's not your team's fault. I learned this the hard way last year when supply costs went nuts and made us look incompetent. Separate those external variances from the stuff you can actually control when reviewing performance. Flag the market-driven ones differently in reports so managers don't get blamed for random economic chaos. Oh, and track those external indicators alongside your variance reports. Context is everything - otherwise you're just staring at confusing numbers.
First thing - figure out what's actually causing the problem. Price increases? Efficiency dropping? Volume issues? Once you know that, you can fix it properly. Maybe renegotiate with suppliers if materials cost too much, or get your team more training if they're struggling with processes. Honestly, better forecasting helps too but that's more of a long-term thing. Set up more frequent check-ins so you don't get blindsided again. The biggest mistake is waiting too long to act - these things snowball fast and become way harder to fix.
Just build variance analysis right into your monthly reports as its own section. Break it down by revenue, COGS, operating expenses - the usual suspects. Charts help a ton, and I'd flag anything over 5-10% variance. Here's the thing though - don't just dump numbers on people. Your finance team has to explain what actually caused each big variance and what you're doing about the bad ones. Otherwise it's just useless data. Make it visual, tell the story behind the numbers, and focus on variances that actually matter.
Honestly, Excel's probably where I'd start - does the job and you already know how to use it. SAP and Oracle have variance modules built right into their ERP systems if you're dealing with tons of data. Power BI and Tableau are awesome for making charts that don't put executives to sleep during presentations (trust me on this one). There's also Adaptive Insights or Hyperion for specialized stuff, but they're kinda overkill unless you really need the bells and whistles. My take? Figure out what works in Excel first. Then you'll actually know what fancy features matter before dropping serious cash on enterprise software.
Variance analysis shows you exactly where you're losing money or crushing it. Like if labor costs jump 15% over budget, you can figure out why and fix it fast. Think of it as your heads-up for problems. The cool part? You take those insights and actually do something - tweak processes, move resources around, retrain people. Positive variances matter too since they show what's working. I'd probably start with your biggest variances first - that's where you'll see real impact. It's honestly like having a GPS for your operations telling you when you've gone off track.
Look, don't get tunnel vision on individual variances - you'll miss the forest for the trees. Chasing every tiny difference is a waste of time (I learned this the hard way). Focus on what actually moves the needle. Update your standards regularly too. Using outdated benchmarks is like driving with last year's GPS. Sure, market conditions affect things, but that can't be your go-to excuse for everything that's off. What matters? Big variances you can actually do something about. The rest is just noise.
So variance analysis is basically the detective work that explains why your KPIs missed their targets. Like if revenue is 5% below budget, it breaks that down into price issues, volume problems, mix changes - all the actual reasons behind the numbers. Honestly it's way more useful than just tracking the KPIs themselves. Instead of your dashboard saying "we missed our goal" and leaving everyone confused, you'll actually know what went wrong and where to focus next. Turns your reporting from a basic scorecard into something that actually helps you manage better.
Look, variance analysis basically shows you where departments are crushing it vs. totally missing the mark budget-wise. When one team's doing great, you can move some of their money to the areas that are struggling. Check both spending AND efficiency though - like maybe marketing is spending less but getting better results, while operations is just hemorrhaging cash for no good reason. Honestly, I'd review this stuff quarterly instead of waiting till the end of the year when you're screwed. It's your best shot at actually fixing things before they get worse.
-
Editable templates with innovative design and color combination.
-
Colors used are bright and distinctive.
-
Out of the box and creative design.
-
Topic best represented with attractive design.
-
Nice and innovative design.