


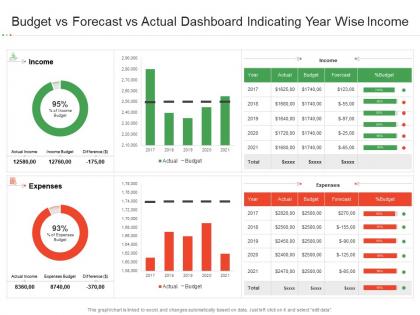
Budget vs forecast vs actual dashboard indicating year wise income




Try Before you Buy Download Free Sample Product
 Impress Your
 Audience
 100%
100% Editable
 Save Hours
 of Time


Our Budget Vs Forecast Vs Actual Dashboard Indicating Year Wise Income are topically designed to provide an attractive backdrop to any subject. Use them to look like a presentation pro.
People who downloaded this PowerPoint presentation also viewed the following :
Budget vs forecast vs actual dashboard indicating year wise income with all 2 slides:
Use our Budget Vs Forecast Vs Actual Dashboard Indicating Year Wise Income to effectively help you save your valuable time. They are readymade to fit into any presentation structure.
FAQs for Budget vs forecast vs actual dashboard indicating
Look at four key areas: profitability stuff like gross margin and ROE, liquidity ratios (current and quick), how efficiently you're turning inventory and collecting receivables, plus your debt-to-equity situation. Honestly, revenue growth looks sexy but these ratios tell you if you're actually making money or just burning through cash. Don't go crazy analyzing every single metric though - that's a rabbit hole. Pick what matters for your specific business. I'd start with the basics, then dig into anything that looks weird or off.
Looking at year-over-year data is honestly the only way to tell if you're actually growing or just seeing normal seasonal stuff. Monthly comparisons? Total mess - they're everywhere. But when you compare the same quarters or months from different years, real trends pop out. Revenue patterns become obvious, profit margins make sense, and you can actually see what's working. Investors eat this stuff up too, especially when they see steady growth year after year. I'd start with your last three years of data to get a solid baseline. Way more reliable than trying to guess from month-to-month chaos.
Think of industry benchmarks as your gut check for whether your company's actually doing well or just looks decent on paper. Like, a 15% profit margin sounds great until you find out everyone else in your space is hitting 25% - ouch. You're basically comparing your ratios and growth rates against what's normal for your industry. Honestly, without these comparisons you're just guessing if your performance is competitive. The tricky part is finding solid, up-to-date data from industry reports or financial databases, but once you do, you'll spot exactly where you're crushing it versus where you need work.
Look at asset turnover and inventory turnover first - they show if a company's actually using what they own efficiently. Working capital ratios are solid too. Honestly, these numbers mean nothing by themselves though. You gotta compare them to competitors and see how the company's been doing over time. Management can look brilliant on paper but still be totally mediocre compared to their industry. I'd say pick 3-4 ratios max to start with. Don't overwhelm yourself with every metric out there - just focus on whether they're moving product fast and not letting assets sit around doing nothing.
Dude, cash flow analysis is like your business's pulse check - way more important than people think. You could be "profitable" on paper but still can't pay rent if the actual cash isn't there. Seen so many businesses crash because of this exact thing. The breakdown shows three buckets: operating, investing, and financing activities. Start with operating cash flow though - that's your bread and butter. If that's in the red while your P&L looks great, you've got a working capital problem that needs fixing yesterday. It's wild how disconnected profits and cash can be sometimes.
Look, managing your assets and liabilities is huge for your bottom line. Better inventory turnover? More cash from the same stuff. Faster collections on what people owe you? Same deal. Debt's trickier though - you want enough to grow but not so much that interest payments kill you. I've seen too many businesses get this wrong and struggle with cash flow. Track your asset turnover and debt ratios monthly. The goal is squeezing max performance from what you own while keeping debt manageable. It's honestly like balancing on a tightrope sometimes.
Look, financial analysis is basically your roadmap for not making dumb decisions. Track your profit trends and cash flow - that's where you'll see what's actually working vs what's just bleeding money. Compare yourself to competitors too (trust me, sometimes the results are brutal). The cool part is you can run different scenarios before throwing cash at something. Maybe you'll realize that product line needs to go, or you're ready to expand. I'd say pick 3-5 key metrics that matter most to your business and watch them like a hawk. Numbers don't lie.
So variance analysis is basically your budget vs reality check - shows you where things went sideways. Red flags pop up when revenue's lower than expected or you're bleeding money on expenses. You can dig into specific departments or products to find the exact problem spots. Honestly, most people just look at the numbers and panic, but the real trick is figuring out WHY it happened. Was it a one-time thing or something bigger? Once you know that, you can actually fix it instead of just scrambling around putting out fires.
Yeah, external stuff like interest rates and inflation can totally mess with how you read your numbers. Your company might actually be crushing it, but the economy makes it look bad - or the opposite. I always check what's happening industry-wide first, honestly saves so much confusion. Compare your metrics to competitors dealing with the same crap. Look at trends over a few years too, not just one quarter. Figure out which economic factors hit your industry worst (like, retail gets hammered differently than tech), then factor that into your analysis. Makes a huge difference.
So those numbers only tell part of the story, you know? Like if margins are dropping, qualitative stuff tells you *why* - is it just temporary supply chain mess, new competitors, or management screwing up? Brand strength, regulatory headaches, how good the leadership actually is - that context is everything. Otherwise you're just guessing what those financial metrics actually mean. I've seen people get burned making decisions off spreadsheets alone. You need the backstory to know if current performance will stick around or if things are about to shift big time.
Look, the biggest mistake is focusing on just one number - like obsessing over revenue while your cash flow tanks. Also don't compare yourself to random industries that have nothing to do with your business (I see this way too often). Seasonal stuff matters too - December sales spikes don't mean you're crushing it year-round. Using old benchmarks is another trap. Mix different metrics together, compare similar companies, and actually think about what's happening in the economy. Context is everything when you're looking at data.
Honestly, the right tech stack will save you so much time on financial analysis. I used to spend forever in Excel pulling monthly reports - now analytics tools grab data from everywhere and build dashboards automatically. The anomaly detection is pretty wild too, catches stuff I'd totally miss. Machine learning spots trends way faster than I ever could manually. But here's the thing - you stop being just a data person and actually get to do strategic work, which is way more fun. I'd start small though. Pick one analysis you hate doing every month and find a tool to automate it first.
Look, start by figuring out where you actually stand compared to your competitors - that's step one. Then pick maybe 2-3 weak spots and hammer those first. Revenue per customer is always a good bet, plus cutting operational waste wherever you can find it. Cash flow stuff matters way more than people think - get tighter on collecting receivables and managing inventory. Oh, and definitely push back on supplier contracts if you haven't lately. Automating the boring repetitive tasks helps too. Honestly, selling off assets that aren't performing can free up resources, though I know that's not always realistic depending on your situation.
So basically, you gotta match your analysis to what your investors actually want to see. Growth investors? They're obsessed with revenue trends and user acquisition - sometimes they literally don't care if you're profitable yet, which is wild but whatever. Value guys want you deep in the weeds on cash flow and asset quality stuff. The timeframes shift too depending on who you're talking to. Growth people want that momentum story, value folks are thinking longer term. Point is, don't just throw random metrics at them or you'll look like you have no clue what they care about.
So basically you're testing out different "what if" scenarios on your numbers - like what happens if sales tank 20% or your costs go through the roof. I always make three versions: best case, worst case, and realistic. That way you won't get blindsided when stuff goes sideways (which it will). Focus on the risks that'd actually wreck your business, not random stuff. Once you see how bad things could get, you can stack up cash reserves or have backup plans ready. It's honestly saved my butt more times than I can count.
-
Best Representation of topics, really appreciable.
-
Appreciate the research and its presentable format.
-
Easy to edit slides with easy to understand instructions.
-
Good research work and creative work done on every template.
-
Illustrative design with editable content. Exceptional value for money. Highly pleased with the product.