

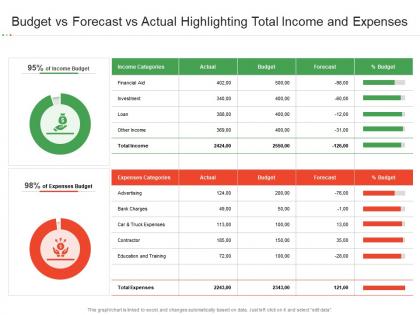
Budget vs forecast vs actual highlighting total income and expenses




Try Before you Buy Download Free Sample Product
 Impress Your
 Audience
 100%
100% Editable
 Save Hours
 of Time


Our Budget Vs Forecast Vs Actual Highlighting Total Income And Expenses are topically designed to provide an attractive backdrop to any subject. Use them to look like a presentation pro.
People who downloaded this PowerPoint presentation also viewed the following :
Budget vs forecast vs actual highlighting total income and expenses with all 2 slides:
Use our Budget Vs Forecast Vs Actual Highlighting Total Income And Expenses to effectively help you save your valuable time. They are readymade to fit into any presentation structure.
FAQs for Budget vs forecast vs actual highlighting total
So budget is what you think you'll spend this year - your best guess upfront. Then forecasting comes in throughout the year when you update those predictions based on what's actually happening. Honestly, most people skip this step but it's super helpful. Actual reporting? That's just tracking what you really spent - no sugarcoating. You'd normally do budgets once a year, forecasts maybe quarterly, and check actuals monthly. The real value is comparing all three because that's how you catch problems early and actually adjust course instead of flying blind.
Ditch the whole "set it and forget it" budget thing - you need rolling forecasts instead. Update them monthly or quarterly using your actual numbers, then tweak your budget accordingly. Here's what works: monthly meetings where you compare all three (budget vs forecast vs actual) and make real adjustments. Most companies mess this up by never touching their budgets after January, honestly. Variable costs and revenue-dependent spending should definitely get revised throughout the year. Set up variance reports so you'll catch trends early. It sounds like extra work but it's way better than flying blind.
Honestly, the worst thing you can do is get crazy optimistic with revenue - I've been there and it sucks when reality hits. Also check that your data isn't ancient. Like, assumptions from six months ago? Probably trash now. Seasonality will mess you up if you ignore it. Same with random market stuff that comes out of nowhere. Oh, and always pad for weird expenses because there's always something. Here's what actually works - run three scenarios. Best case, worst case, and what'll probably happen. Sounds boring but you'll thank me when things go sideways, which they will.
Your actual results are basically a reality check for next year's budget - they show where you totally missed the mark and what's actually happening in your business. Do variance analysis to see where you kept over or underestimating stuff. Then fix your forecasting models. So many people just copy last year's numbers though (please don't). The actuals also show seasonal patterns, random costs that hit you, or revenue streams you didn't even notice. Oh and honestly? Use this data to actually learn something instead of just shoving it in a file somewhere and forgetting about it.
Honestly? I'd say monthly minimum, but quarterly hits the sweet spot for most businesses. Your forecast gets stale super quick when markets shift or you hit unexpected bumps. Monthly check-ins help you spot trends before they bite you in the ass - sorry, had to say it. Small problems turn into big ones fast if you're not paying attention. Seasonal or crazy volatile business? Maybe do it more often. The trick is finding what works without making your team hate forecast updates. Nobody wants to live in spreadsheet hell, but you also can't just set it and forget it.
Okay so variance analysis is basically your detective work for figuring out what went sideways between your plan and reality. You're comparing budget vs actual, forecast vs actual, all that fun stuff to spot patterns. Honestly sounds super dry but it gets weirdly addictive once you start connecting the dots. Look at both dollar amounts and percentages - gives you the full picture of what actually matters. Oh and pro tip: tackle the biggest variances first. Don't waste time on tiny differences that won't change anything meaningful.
Dude, heat maps are seriously a lifesaver for budget stuff. Instead of staring at endless spreadsheet rows, you just look at the colors - red means over budget, green means under. Takes like two seconds to spot which departments are consistently screwing up or if there's weird seasonal spending patterns. I actually can't believe I used to torture myself with regular tables before this. Your boss will love it too since they can instantly see what's broken without you having to explain a million numbers. Set up a monthly dashboard and boom - variance analysis that doesn't make everyone's eyes glaze over.
Honestly, Excel or Google Sheets work fine if you're just starting out, but they become a total pain once your data gets complicated. Power BI and Tableau are way better for the three-way comparisons - the visualizations actually make sense and you can dig into variances without wanting to throw your laptop. Bigger companies usually go with FP&A tools like Anaplan since they're made for this stuff. My advice? Figure out which metrics your stakeholders actually care about first (trust me, this saves headaches later), then pick whatever tool can automate those monthly reports so you're not stuck pulling data manually every time.
Look, historical data is like having a cheat sheet for your budget. Pull your actual vs budget reports from the last 2-3 years - you'll spot spending patterns you totally forgot about. Maybe you budgeted 10K for marketing but blew 15K every quarter? That's gold right there. Seasonal trends become obvious too. I always find at least one category where my estimates were consistently terrible. The weird one-time expenses get smoothed out when you look at longer periods, which is why I never trust just one year of data. Start with the biggest variances first.
Honestly, if your forecasts are that far off, you gotta start doing rolling updates - like monthly or quarterly instead of waiting a whole year. Figure out what went sideways first though. Market shift? Internal mess-up? Just crappy assumptions from the start? Then tweak your budget categories based on what you find. I'd set up some kind of flexible system where certain expenses automatically adjust when revenue changes. Oh, and scenario planning is clutch - having best/worst case budgets ready will save you tons of stress later. Don't wait around wondering what happened. Set specific trigger points that force you to review and adjust things before they get worse.
Honestly, just talk to your stakeholders more. I know it sounds obvious, but explaining the "why" behind budget variances builds way more trust than dumping spreadsheets on people. They usually know stuff you don't anyway - like if sales changed their strategy or ops hit some weird snag. Don't wait for month-end to surface problems either. Send quick explanations with your numbers instead of raw data. I've watched finance teams spiral trying to solve discrepancies alone when a 5-minute conversation would've cleared everything up. Regular check-ins let you fix forecasts as you go rather than playing catch-up later.
Start with the biggest variances - what's way off from plan and why. Skip the rainbow colors though, execs hate that visual mess. Trends matter way more than single snapshots, so show data over time. The forecast part is honestly where you shine - explain how outside stuff and business moves are changing your numbers. One page max if you can swing it. Oh, and definitely bring backup details because they'll always drill down on something random. It's all about telling the story behind the numbers, not just dumping data on them.
So scenario planning is basically stress-testing your budget with different "what if" situations. You make multiple versions - best case, worst case, realistic case. Pretty smart actually. When things go sideways (and they will), you're not scrambling to redo everything from scratch. You just switch to whichever scenario matches what's happening. It's like... I don't know, having multiple GPS routes ready when traffic hits? Start with your biggest unknowns and build scenarios around those. Way better than flying blind with just one forecast.
Start with variance percentages - you want actuals within 5-10% of budget and forecast for most stuff. Revenue's obviously huge, but expense ratios matter too. Cash flow timing can bite you if you're not careful. Track your forecast accuracy over time because that's how you know if you're actually getting better at this whole planning thing. Rolling forecasts are gold here - shows whether you can predict the next few months worth a damn. Monthly variance reports are your friend. Make people explain anything over 15% off. Trust me, those explanations tell you everything about what's really going on.
Honestly, economic indicators are like your early warning system for forecasting. GDP growth, unemployment, consumer confidence - all that stuff gives you hints about where things are headed. You can't predict everything (nobody can), but tracking the right metrics helps you tweak your revenue projections before you're totally blindsided. The key is figuring out which indicators actually matter for your specific industry. Oh, and definitely update your forecasts when fresh economic data comes out - maybe quarterly? Trust me, it beats having to explain to your boss why your numbers were completely off base.
-
Enough space for editing and adding your own content.
-
Helpful product design for delivering presentation.