

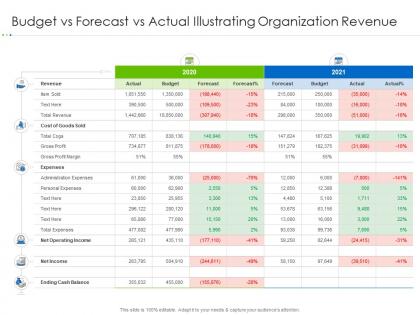
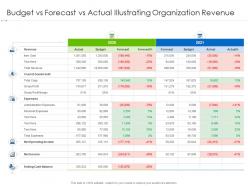
Budget vs forecast vs actual illustrating organization revenue




Try Before you Buy Download Free Sample Product
 Impress Your
 Audience
 100%
100% Editable
 Save Hours
 of Time


Our Budget Vs Forecast Vs Actual Illustrating Organization Revenue are topically designed to provide an attractive backdrop to any subject. Use them to look like a presentation pro.
People who downloaded this PowerPoint presentation also viewed the following :
Budget vs forecast vs actual illustrating organization revenue with all 2 slides:
Use our Budget Vs Forecast Vs Actual Illustrating Organization Revenue to effectively help you save your valuable time. They are readymade to fit into any presentation structure.

FAQs for Budget vs forecast vs actual
Track your total revenue and growth rate first - that's baseline stuff. Then dig into revenue per customer and break everything down by product lines and customer segments so you can see what's actually working. If you're SaaS, monthly recurring revenue is pretty much non-negotiable at this point. Average deal size matters too, plus customer acquisition cost versus lifetime value. Oh, and definitely watch how much revenue comes from your biggest customers - I've seen companies get burned when one major client walks away. These basics will give you what you need to spot patterns.
Honestly, ignoring seasonal trends will mess up your revenue projections big time. Look at 2-3 years of past data first - retail always explodes in Q4, travel tanks in January, that stuff. I made this mistake once with B2B sales, completely forgot about summer being dead and my forecasts were way off. Build different models for busy seasons vs slow periods instead of using the same growth rate everywhere. Calculate seasonal indices to bump your baseline up or down for each quarter. Oh and weight everything based on your actual historical patterns - makes a huge difference in getting realistic numbers.
Honestly, it's all about what industry you're in and how much data you've got. Retail and manufacturing companies kill it with time series analysis because they have years of solid historical data. Tech companies? Totally different story - they lean heavy on cohort analysis since their growth is all over the place. SaaS folks are obsessed with ARR modeling and tracking churn (and for good reason). Enterprise software needs pipeline forecasting since those deals take forever to close. Start simple with whatever matches your current setup. You can always get fancier later once you've got the basics down.
Honestly, competitor analysis is a game-changer for revenue forecasting. You'll see how similar companies handled market shifts and what pricing actually works in practice. I usually pick 3-5 direct competitors and track their quarterly numbers alongside mine. Their product launches and seasonal patterns give you solid external validation for your internal forecasts. Way better than just guessing, you know? You can spot industry trends before they mess with your numbers, plus it's kind of fascinating to see where you actually stand in the market. Makes your predictions so much more grounded in reality.
Honestly, customer segmentation is where things get interesting with revenue analysis. Instead of staring at one giant blob of data, you're breaking customers into groups by behavior, spending, demographics - whatever makes sense. The cool part? You'll actually see which segments are your money-makers and which ones... well, aren't pulling their weight. I always tell people to start with their top 20% first - that's usually where you find the easiest wins. You might discover your high-spenders want premium stuff, or that certain groups need totally different messaging. It's way easier to make smart decisions when you can see these patterns clearly.
Honestly, pricing is everything when it comes to revenue - it's literally what determines your cash flow per sale. I'd start by A/B testing different price points, maybe 10-15% variations to see what actually works. Look at what competitors are charging too, but don't just copy them blindly. Your customers' willingness to pay is way more important. Check your price elasticity - how much does demand drop when you raise prices? Sometimes you make more money selling fewer units at higher prices, which sounds backwards but isn't. Oh, and definitely segment your customers first since different groups will react totally differently to price changes.
Honestly, visualizing your revenue data will save you so much time. Spotting trends and seasonal drops becomes super obvious when you're looking at charts instead of endless spreadsheet rows. I mean, who wants to scroll through thousands of numbers? You'll quickly see which products or regions are actually making money. Charts also help when presenting to stakeholders - they actually look at visuals instead of glazing over at tables. Start with Tableau if your budget allows it, or even Excel's charting works great for basic monthly trends. Way better than trying to math your way through raw data.
The biggest pain points? Data scattered everywhere, inconsistent tracking, and timing headaches - like figuring out when to count revenue vs when money actually shows up. Q4 numbers always look incredible until you realize... oh right, holidays. Start by getting your data collection standardized. Integration tools are worth the investment to connect sales, billing, and accounting. Set up automated dashboards so you're not scrambling for numbers every month (learned this the hard way). Revenue recognition rules need to be crystal clear from day one and actually followed consistently. Trust me on that last part.
Dude, your old revenue data is like having a roadmap for what actually works. Pull up the last 2-3 years and see what products made you the most money - then focus more on those. You'll also spot when things get slow (holidays, summer, whatever) so you can prep with extra marketing or just plan to spend less. Most people have all this info sitting around but never actually look at it, which is kinda crazy. Compare how you did this year vs last year, figure out which customers are worth the most. Then use all that to set budgets that aren't completely made up.
Honestly, recurring revenue is a game changer for cash flow - you can actually predict what's coming in next month instead of constantly scrambling for new sales. Sure, one-time transactions give you that nice upfront hit, but then you're back to square one hunting customers again. It's exhausting. Your metrics shift completely too. Instead of just counting transactions, you're watching monthly recurring revenue and churn rates. The math works out better long-term since customer lifetime value compounds, though I'll admit the slower start can feel frustrating. Track both acquisition costs and lifetime value - that'll show you which approach actually makes sense for your specific situation.
Honestly, your revenue data is like a treasure map if you know how to read it. Check which customer segments or regions are quietly booming - sometimes the best opportunities are hiding in plain sight. I always get excited when I find those weird spikes nobody expected. Flip side though - don't ignore where you're bleeding money. That decline might mean competitors found something you missed. Compare everything across time periods and you'll start seeing gaps where you could jump in. Works way better than just guessing what might work.
So top-line is basically all your revenue - every dollar that comes through the door before you subtract costs. Bottom-line? That's what you actually pocket after expenses, taxes, all that fun stuff. Revenue shows if people want what you're selling and how well your sales team's doing. Profit tells you if you're running things efficiently. Honestly, I've seen way too many founders get excited about hitting revenue goals while they're bleeding money. My buddy's startup did this for like two years - looked great on paper until reality hit. You really need both numbers to know if your business is actually healthy or just looks busy.
Look, the economy basically sets your sales ceiling and floor. Strong economy = people spend more. Weak one? Budgets shrink fast. Track inflation, unemployment, consumer confidence, and interest rates - they all mess with buying power. GDP matters too, though it feels abstract until your numbers actually drop. I'd set up Google alerts for economic reports and check them monthly when you're doing forecasts. Sounds boring but trust me, it beats getting blindsided. Oh, and watch what competitors are doing - sometimes that tells you more than the official data does.
Honestly, automating your revenue tracking is a game changer. You can connect your CRM, payment systems, and accounting software so everything syncs automatically - no more copy/paste hell. AI tools will catch trends and weird patterns you'd totally miss otherwise. Plus forecasting gets way easier. Real-time dashboards mean you can see all your revenue streams instantly instead of jumping between like five different systems (which is exhausting, trust me). I'd start with whatever manual process takes you the longest - you'll notice the difference right away. The time savings alone make it worth it.
Dude, you'll get way better insights when you actually talk to other teams instead of just staring at spreadsheets all day. Sales can tell you why deals got pushed to next quarter. Marketing knows which campaigns are actually driving revenue (spoiler: it's usually not the fancy ones). Product team understands how new features affect customer spending. I mean, we finance people are good with numbers but sometimes we totally miss the story behind them. Set up monthly cross-team meetings where everyone shares what they're seeing. Trust me, you'll catch problems way earlier and your forecasts won't suck as much.
-
Helpful product design for delivering presentation.
-
Attractive design and informative presentation.
-
Awesome presentation, really professional and easy to edit.
-
Thanks for all your great templates they have saved me lots of time and accelerate my presentations. Great product, keep them up!
-
Easily Understandable slides.