


Product Shipping And Revenue Analysis Dashboard




Try Before you Buy Download Free Sample Product
 Impress Your
 Audience
 100%
100% Editable
 Save Hours
 of Time


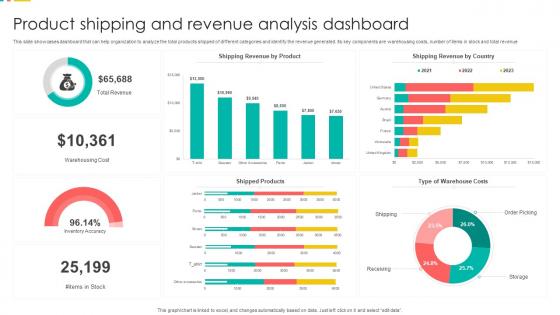
This slide showcases dashboard that can help organization to analyze the total products shipped of different categories and identify the revenue generated. Its key components are warehousing costs, number of items in stock and total revenue.
People who downloaded this PowerPoint presentation also viewed the following :
Product Shipping And Revenue Analysis Dashboard with all 7 slides:
Use our Product Shipping And Revenue Analysis Dashboard to effectively help you save your valuable time. They are readymade to fit into any presentation structure.





FAQs for Product Shipping And
A comprehensive shipping revenue dashboard should include total revenue by route, freight volume trends, average revenue per shipment, customer profitability analysis, and cost-per-mile metrics. These components enable logistics managers to identify high-performing routes, optimize pricing strategies, and streamline operational efficiency, with many shipping companies finding that integrated dashboards ultimately deliver faster decision-making and enhanced competitive advantage.
Data visualization enhances shipping revenue understanding by transforming complex datasets into clear charts, graphs, and interactive dashboards that reveal patterns, seasonal fluctuations, and performance metrics at a glance. Through visual analytics, shipping companies can identify profitable routes, track customer segments, and monitor operational efficiency, while stakeholders quickly grasp revenue drivers, ultimately enabling faster strategic decisions and improved resource allocation.
Real-time data enables shipping revenue dashboards to provide immediate visibility into freight rates, cargo volumes, route performance, and fuel costs, allowing for dynamic pricing adjustments and operational decisions. Through continuous data streams, shipping companies can quickly identify revenue opportunities, optimize vessel utilization, and respond to market fluctuations, ultimately delivering enhanced profitability and competitive advantage.
Shipping companies can utilize dashboards to forecast future revenue by analyzing historical shipping volumes, seasonal patterns, route performance, fuel cost trends, and market demand indicators. These predictive analytics tools enable maritime operators to optimize capacity planning, adjust pricing strategies, and anticipate cash flow fluctuations, ultimately delivering more accurate financial projections and competitive advantage in volatile shipping markets.
Common data sources for shipping revenue dashboards include transportation management systems, customer relationship management platforms, enterprise resource planning software, freight billing systems, and route optimization tools. These systems streamline operations by consolidating shipment tracking, customer data, and financial metrics, enabling logistics companies to enhance operational efficiency, reduce costs, and deliver better customer experiences while gaining competitive advantage.
A dashboard helps identify shipping inefficiencies by visualizing key metrics like delivery delays, route optimization gaps, fuel consumption patterns, and carrier performance inconsistencies in real-time. Through centralized data tracking, logistics managers can quickly pinpoint bottlenecks, compare actual versus planned costs, and streamline operations, ultimately reducing expenses while enhancing delivery reliability and customer satisfaction.
Integrating shipping revenue dashboards with business analytics tools enables comprehensive performance visibility, streamlined data management, automated reporting, enhanced forecasting accuracy, and cross-functional collaboration. This strategic combination allows logistics companies, e-commerce platforms, and freight organizations to identify cost optimization opportunities, predict seasonal trends, and align shipping performance with broader business objectives, ultimately delivering operational efficiency and competitive advantage.
User experience design significantly influences shipping revenue dashboard effectiveness by ensuring intuitive navigation, clear data visualization, customizable views, and responsive interface design that supports quick decision-making. Well-designed dashboards enable logistics managers and shipping executives to rapidly identify revenue trends, monitor performance metrics, and optimize operations, while poor UX can hinder data interpretation, ultimately delivering enhanced operational efficiency and strategic advantage in competitive shipping markets.
Effective shipping revenue segmentation includes route analysis, carrier performance, service type breakdown, customer categorization, and seasonal patterns. These approaches streamline operational insights by identifying profitable shipping lanes, optimizing carrier partnerships, and tracking delivery performance metrics, with many logistics companies finding that geographic and temporal segmentation ultimately delivers enhanced cost control and strategic routing decisions.
Predictive analytics enhances shipping revenue dashboards by forecasting demand patterns, optimizing route pricing, identifying seasonal trends, and predicting customer behavior shifts. Through machine learning algorithms, shipping companies can anticipate market fluctuations, adjust capacity allocation strategically, and implement dynamic pricing models, ultimately delivering improved profit margins and competitive positioning in increasingly volatile logistics markets.
Shipping companies face challenges including data integration from multiple systems, real-time tracking complexities, crew training requirements, and initial implementation costs. While these obstacles require strategic planning and resource allocation, many maritime organizations find that comprehensive dashboards ultimately streamline operations, enhance decision-making accuracy, and deliver significant competitive advantages through improved visibility into revenue streams and operational efficiency.
Shipping revenue dashboards should update in real-time or at minimum daily intervals, depending on business volume and decision-making needs, with automated data feeds from order management systems, carrier APIs, and financial platforms. Many logistics companies find that hourly updates during peak periods and daily updates during standard operations deliver optimal accuracy while enabling rapid response to revenue fluctuations and operational adjustments.
A shipping revenue dashboard assists strategic decision-making by providing real-time visibility into route profitability, carrier performance, customer segments, and cost trends across operations. Through comprehensive analytics, logistics managers can optimize shipping partnerships, identify underperforming routes, and adjust pricing strategies, while ultimately enhancing operational efficiency and competitive positioning in an increasingly complex supply chain landscape.
Mobile accessibility enhances shipping revenue dashboard utility by enabling real-time monitoring, instant decision-making, and seamless field operations management for logistics teams. Through responsive design and mobile optimization, managers can track shipment performance, revenue metrics, and operational efficiency from warehouses, ports, or client locations, ultimately delivering faster response times and improved coordination across distributed logistics operations.
Critical shipping profitability indicators include revenue per shipment, gross margin percentage, cost per mile, fuel efficiency ratios, and customer acquisition costs. These metrics enable logistics companies to streamline operations by identifying unprofitable routes, optimizing fleet utilization, and enhancing pricing strategies, with many shipping organizations finding that integrated dashboard monitoring ultimately delivers improved operational efficiency and competitive advantage.
-
Great experience, I would definitely use your services further.
-
The service is fast, and I could access any presentation after buying the subscription. I don’t think I’ll ever have to worry about a presentation in my life.