


Annual Sales Performance Review Powerpoint Presentation Slides




Try Before you Buy Download Free Sample Product
 Impress Your
 Audience
 100%
100% Editable
 Save Hours
 of Time


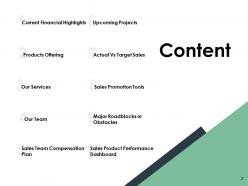
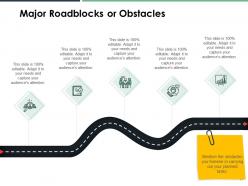
Analyze the growth of your company by using our content ready Annual Sales Performance Review PowerPoint Presentation Slides. With the aid of this performance review PPT layout, you can showcase your current financial highlights such as revenue, gross profit, net profit margin, and earnings per share. Portray the services your company provides to the customers such as digital advertising, marketing & analytics, digital care package, and security & maintenance. Take the assistance of our annual sales implementation PowerPoint theme to explain your sales team compensation plan in detail. This information will hold the interest of the customers and also the other stakeholders present in the markets. Employ this professionally designed sales performance review presentation template to outline the promotion tools like premiums, specialties, price reductions, coupons, sampling, rebates, sweepstakes, contests, and games. Take advantage of this outwardly engaging annual sales performance PowerPoint theme to mention the obstacles you foresee in carrying out your planned tasks. Run your business plan smoothly by downloading our ready-to-use performance review powerpoint presentation slides now.
People who downloaded this PowerPoint presentation also viewed the following :
Content of this Powerpoint Presentation
Annual business numbers are the most important to understanding how a business did over the past 12 months. These numbers signal financial accomplishments, the quality of management and the whether stakeholders pulled together. At SlideTeam, we have curated high-class complete decks in PPT to map financial achievements of businesses, and chart a way forward.
This blog will explore in greater depth a complex sales team compensation plan that will inspire your staff towards more excellent targets while looking at the array of promotional tools—from premiums to contests—that engage customers and drive sales. This presentation prepares you to face the obstacles with the forewarned predictions, walking through so that your business plan keeps rolling over smoothly.
Boost your team's performance with insights that drive success. Discover our Annual Sales and Marketing Team Performance Review template today!
Template 1: Current Financial Highlights
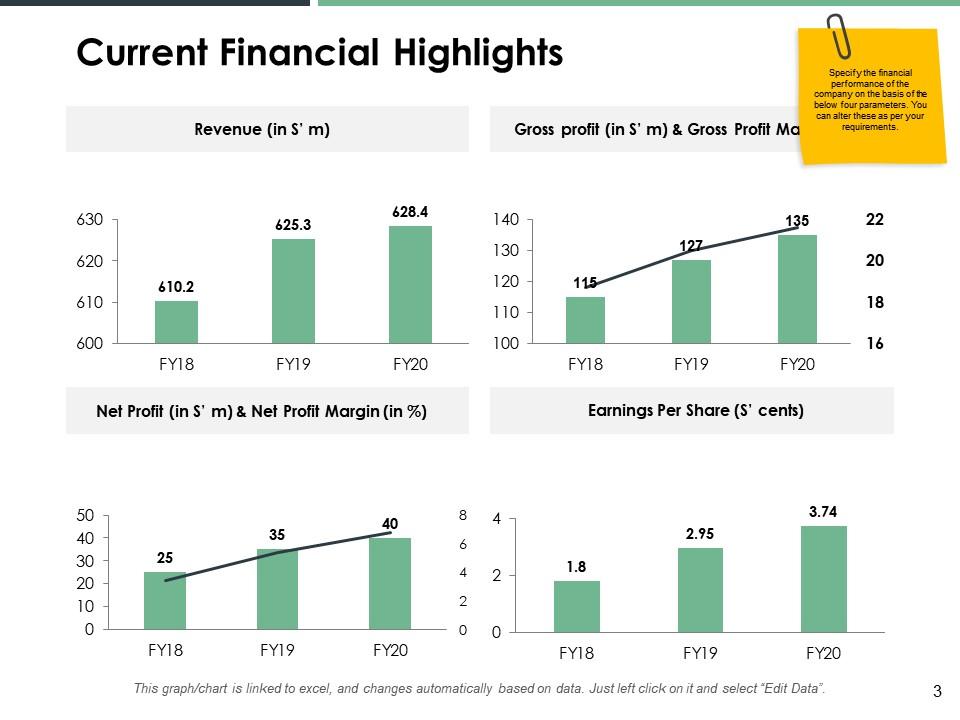
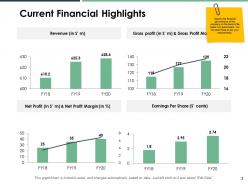
This PowerPoint Template offers a real-time view of a company’s financial journey over three fiscal years. It is a wonderfully presented story of how numbers can be critical to the success of any business. The slide presents key metrics, such as a bar graph trace in revenue growth and a combined graph for gross profit and margin. A bar graph is chosen medium, again, for earnings per share with measures of sales growth, profitability, and shareholder value also being presented. The slide is designed for customization, with editable comment icons and an Excel-linked functionality for real-time data updates. It’s a perfect fit for financial presentations, allowing for quick edits and tailored data to suit business needs and audience insights, ensuring your financial review is not just thorough but also engaging.
Template 2: Our Services
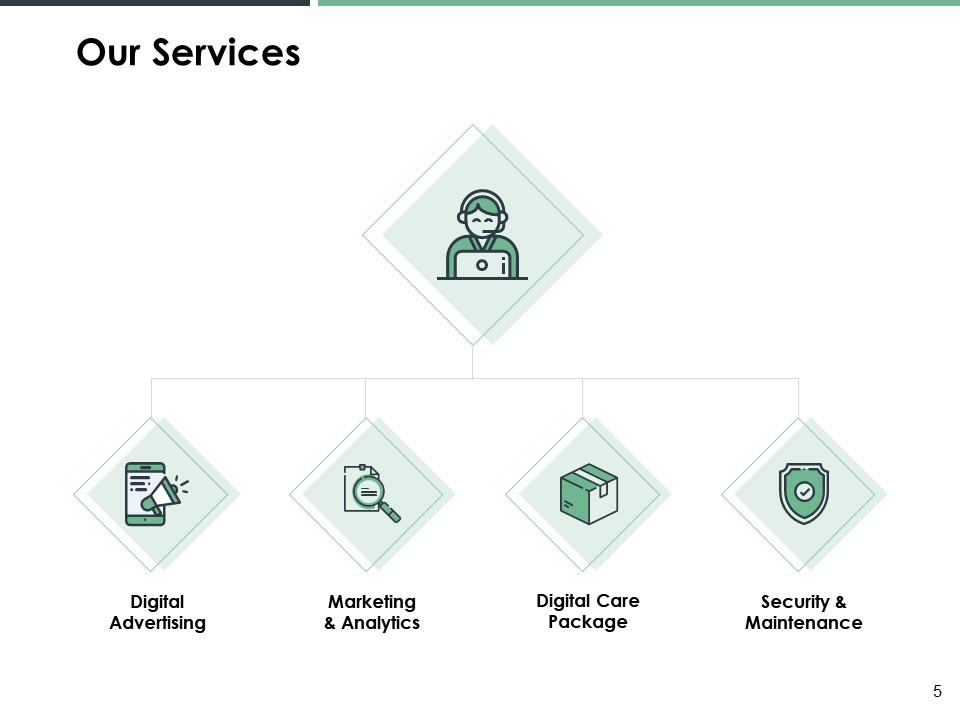
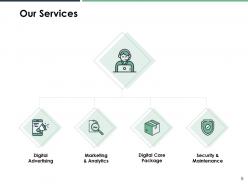
Use this PPT to represent a company's array of offerings through a clutter-free design, with clear emphasis on clarity and professionalism. With four diamond-shaped icons, it features services in Digital Advertising, Marketing & Analytics, Digital Care Package, and Security & Maintenance, each with a representative icon — a mobile ad, a document under scrutiny, a care package, and a protective shield.
Template 3: Sales Team Compensation Plan
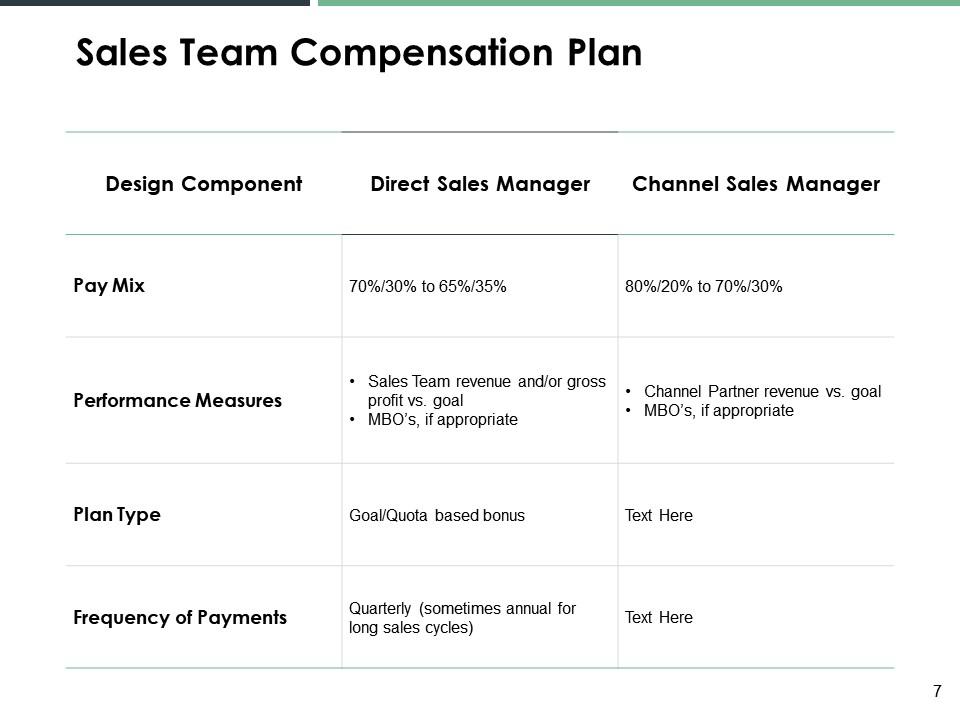
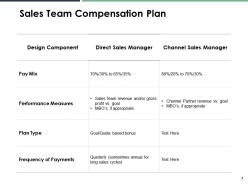
This PPT Template delineates the remuneration framework for direct sales managers and channel sales Managers. It details the pay mix, illustrating the proportion of base salary to commission for each role, with Direct Sales Managers having a range between 70/30 to 65/35 and Channel Sales Managers between 80/20 to 70/30. Performance measures are listed, such as sales team revenue versus goals and the possibility of incorporating Management by Objectives (MBOs). The plan type is indicated as a goal/quota-based bonus for Direct Sales Managers. The section for Channel Sales Managers is left open for tailored input. Payment frequencies are outlined as well.
Template 4: Sales Promotion Tools
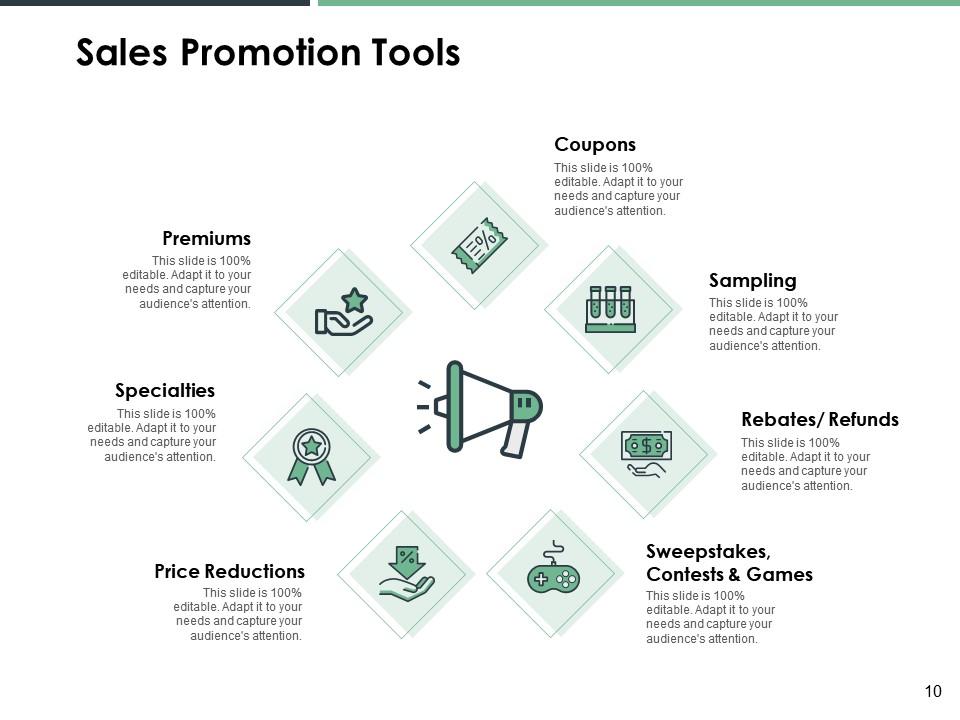
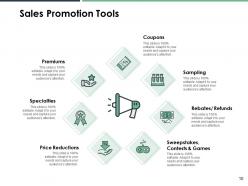
Use this customizable template to outline and illustrate marketing strategies with its neatly arranged sections for "Premiums," "Specialties," "Price Reductions," "Coupons," "Sampling," "Rebates/Refunds," and "Sweepstakes, Contests & Games." Each tool is accompanied by an intuitive icon—a star for premiums, a loudspeaker for specialties, a downward arrow for price reductions, a coupon cut-out for coupons, test tubes for sampling, currency for rebates/refunds, and a game controller for sweepstakes and contests.
The design of icons is unique in its consistency, and coupled with the placeholder text, emphasizes the template's adaptability. This slide helps you create marketing presentations that showcase a set of promotional tactics that mesmerize the audience. At the same time, the slide serves the purpose of enhancing the understanding of sales drivers.
Template 5: Actual vs Target Sales
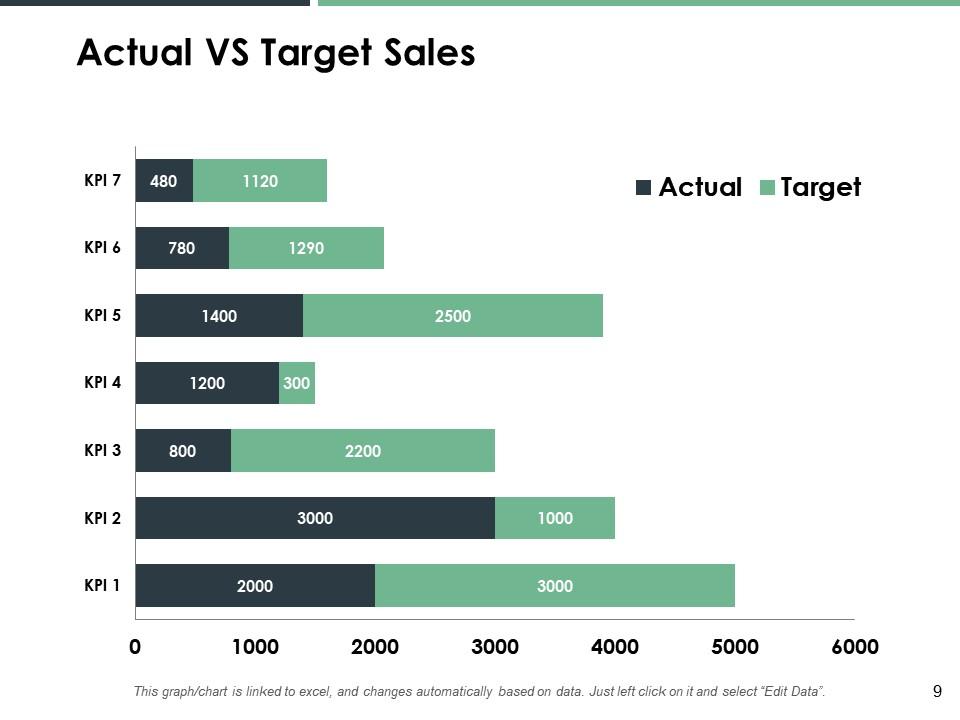
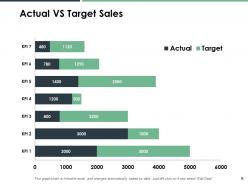
The PowerPoint slide is the perfect solution for presenting sales data. It also illustrates how to compare actual sales figures against predetermined targets across seven KPIs. The horizontal bar chart design puts across the actual achievements in a darker hue against the lighter-colored projected goals, with numbers printed directly on the bars. The slide is equipped with a range of up to 6,000 units and boasts an Excel-linked feature for seamless data updates. For a dynamic sales environment, this slide is a perfect fit. It is also needed for concise presentations during sales meetings or performance evaluations.
Boost your strategic planning with our Annual Sales Performance Review Dashboard! Uncover vital sales KPIs and revenue insights for informed decision-making. Download now and move your business forward.
Template 6: Sales Product Performance Dashboard
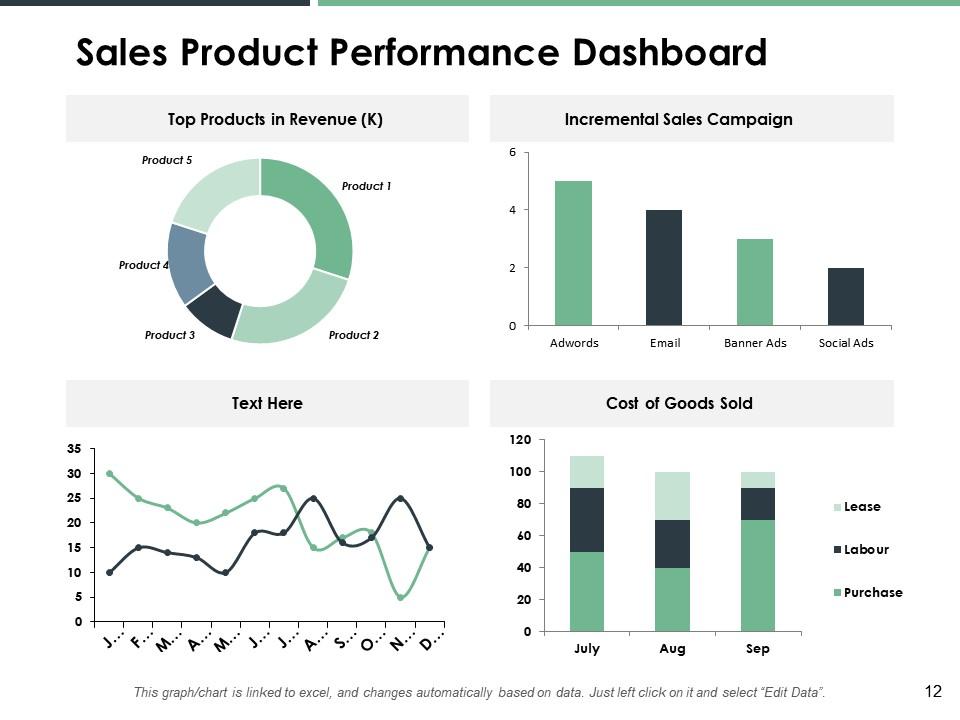
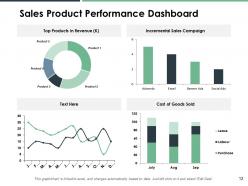
Businesses need to use an integrated analytical tool for assessing a company’s sales dynamics, comprising a donut chart for revenue by product, a bar chart for campaign-driven sales, an unidentified monthly trend line graph, and a stacked bar chart for dissecting the cost of goods sold. This multi-chart slide facilitates identification of revenue-generating products, evaluates the efficiency of sales campaigns, observes sales trends across the year, and provides a detailed breakdown of monthly costs associated with product sales, including lease, labor, and purchase expenses.
Charting Success with Insights into Strategy
This complete deck is the best set for any organization going through a review of its annual performance and consolidated strategic perspective of the activities in front. This is a very well-designed template that delves into details of each, from the "Current Financial Highlights" to the "Sales Product Performance Dashboard".
Unlock the potential of your sales team with our expertly designed "Annual Sales Performance Review Of An Employee" slide. Download now to showcase target achievements and drive improvements in customer management with ease.
Annual Sales Performance Review Powerpoint Presentation Slides with all 22 slides:
Use our Annual Sales Performance Review Powerpoint Presentation Slides to effectively help you save your valuable time. They are readymade to fit into any presentation structure.


FAQs for Annual Sales Performance Review
Revenue growth and quota attainment are your big ones - track those religiously. Win rates, deal velocity, and customer acquisition costs matter too. I'd also watch average deal size and how well your pipeline converts. Activity stuff like calls and meetings help you see if your team's actually putting in the work (sometimes the numbers surprise you there). Don't sleep on retention and upselling metrics either since existing customers are way easier to grow than finding new ones. Throw it all in a dashboard so you can actually spot what's trending instead of drowning in spreadsheets.
Honestly, charts and graphs are so much better than staring at endless spreadsheet rows. You'll catch patterns instantly - seasonal drops, which regions are killing it, what products actually make money. Like, I spent way too much time last month just scrolling through numbers when I could've made a simple trend line in 5 minutes. Visual stuff helps you connect dots between different metrics way faster. You can spot correlations you'd never see otherwise. The decisions become obvious once everything's laid out visually. Start simple though - just basic trend lines for your main numbers first.
Look, goal setting is literally your GPS for the whole year. It shows you where to dump your energy and budget instead of just throwing stuff at the wall. I always tell people - make them super specific. "Increase sales" means nothing, but "grow enterprise accounts by 25% in Q2-Q3" actually gives your team direction. Without clear goals, you'll have everyone working crazy hard but pulling in different directions. Trust me, I've seen it happen. Your annual review should nail down which markets matter most and what products to push hardest.
Your annual review can get totally screwed up by seasonal stuff if you're not paying attention. I found this out the hard way when everyone looked like garbage after that whole supply chain disaster last year - honestly, what a mess that was. Make sure you're getting compared to realistic benchmarks that factor in things like holiday rushes or summer dead periods. Don't let them judge you against some perfect world scenario that didn't exist. Push for year-over-year comparisons instead. Industry context matters too. Your manager needs to see what conditions you were actually dealing with, not some fantasy baseline.
Honestly, start with Gartner or IDC reports - they've got solid industry benchmarks. Your CRM probably has comparison features built in too (most do now). LinkedIn Sales Navigator is surprisingly useful for peer insights, and tools like ZoomInfo can show you competitive data. Also, don't sleep on public info - competitor earnings calls are goldmines if you can stomach listening to them. I'd focus on maybe 2-3 metrics first like conversion rates and deal velocity. Trade association data is decent too, though sometimes it's outdated. Pick what actually matters to your business and build from there.
Oh man, team feedback is gold for performance reviews. Your coworkers catch stuff you'd totally miss - like how someone actually communicates under pressure or handles those crazy deadline weeks. Plus they know what roadblocks keep popping up that management doesn't see. I've watched so many development plans crash because nobody asked the team what would actually help. Get input from peers too, not just the people below them. That way you can build goals that make sense and the whole team will actually get behind. Sounds obvious but people skip this step all the time.
Dude, customer feedback is everything for your sales review. Sure, you might be closing deals left and right, but if people hate working with you? That's gonna come back to haunt you through terrible renewals and word-of-mouth. I've literally watched reps with solid numbers get absolutely roasted because their satisfaction scores sucked. Leadership wants to see if your approach actually works long-term or if you're just burning bridges. Track those follow-up surveys and renewal rates - not just how many you close initially. Trust me on this one.
Honestly, just automate the data pulling first - no more juggling five spreadsheets like some kind of circus act. Set up dashboards that actually update throughout the year so you're not scrambling last minute. AI tools can spot patterns in your team's performance too, which is pretty neat for coaching. Oh, and those digital review platforms? Game changer. Everything stays organized in one spot instead of scattered everywhere. Start connecting your current tools to generate reports automatically. Trust me, you'll thank yourself when review season rolls around and everyone else is pulling all-nighters.
So basically, just match the training to whatever came up in their reviews. Someone can't close deals? Get them into negotiation workshops or have them shadow your best closers. Prospecting numbers suck? CRM training or lead gen courses. For your top performers though - and this is where most managers mess up - give them leadership development or advanced sales stuff. Maybe have them mentor the struggling folks. Honestly way more fun than generic training everyone hates anyway. Just be specific about each person's actual weak spots instead of doing some blanket approach that doesn't help anyone.
Yeah, so basically they weight each channel differently because they're measuring completely different things. Online stuff is all about conversion rates and how much you're spending to get customers. In-store is more about turning foot traffic into actual sales and getting people to buy extra things. Direct sales? That's relationship stuff - way more personal. Honestly I think direct sales is the hardest to measure but whatever. Your manager better not be comparing your online numbers to someone's in-store performance though - that's just dumb. Focus on whatever metrics matter most for your main channel and really push those numbers when review time comes around.
Look, first thing - figure out what's actually going wrong. Skills issue? Wrong territory? Just not motivated? Once you know that, set up a real performance plan with specific goals and deadlines. Honestly, pairing them with your best rep for mentoring works wonders - I've seen it turn people around completely. Bump up your check-ins to weekly too. Maybe they need more training on your process or tools, who knows. Give it 90 days max though. If they're still struggling after that, time for the uncomfortable conversation about fit.
When someone crushes it, shout it from the rooftops! Be super specific about what they actually did - not just "nice work." Share those wins in meetings and company updates. Connect their exact actions to the results they got, then other people can copy what worked. Honestly, the generic praise thing is pretty useless. People want to know their effort mattered. Throw in some spot bonuses if you can swing it. The whole point is making sure everyone sees what good looks like and feels appreciated when they nail it.
Put your big numbers right at the top - revenue, quota hits, trends. People want the headline stuff first. Visuals work way better than spreadsheet chaos (seriously, nobody reads those). Don't just tell them what happened - dig into why performance shifted and what that means going forward. You'll want to slice the data by territory, product, or rep so managers actually have something to work with. Oh, and always wrap up with clear next steps. Otherwise you're just giving them a history lesson nobody asked for.
Try breaking down each rep's performance using SWOT - strengths, weaknesses, opportunities, threats. So like, maybe Sarah crushes at closing but sucks at prospecting. Or Tom's got great relationships but can't figure out the new CRM (honestly, who can blame him). Check what opportunities they're missing in their territory and which competitors keep stealing their deals. Way better than just staring at quota numbers. You'll catch stuff you'd totally miss otherwise. Then you can actually build development plans that fix what's really broken instead of generic training nobody needs.
Honestly, competitor analysis is a game-changer for understanding your sales numbers. Say your sales dropped 10% but competitors fell 15% - you're actually winning! It shows whether your struggles are just you or happening industry-wide. You'll see where rivals are crushing it and steal their best moves. Plus it helps set realistic goals based on actual market conditions instead of just hoping things get better. Way better than just comparing to last year's numbers in a vacuum. Oh, and your team will appreciate benchmarks that actually make sense for once.
-
Appreciate the research and its presentable format.
-
Excellent design and quick turnaround.