

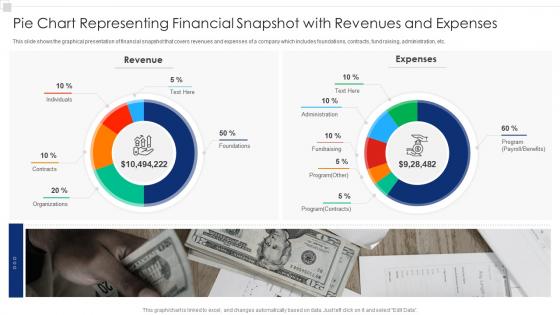
Pie chart representing financial snapshot with revenues and expenses




Try Before you Buy Download Free Sample Product
 Impress Your
 Audience
 100%
100% Editable
 Save Hours
 of Time


Our Pie Chart Representing Financial Snapshot With Revenues And Expenses are topically designed to provide an attractive backdrop to any subject. Use them to look like a presentation pro.
People who downloaded this PowerPoint presentation also viewed the following :
Pie chart representing financial snapshot with revenues and expenses with all 7 slides:
Use our Pie Chart Representing Financial Snapshot With Revenues And Expenses to effectively help you save your valuable time. They are readymade to fit into any presentation structure.





FAQs for Pie chart representing financial snapshot with
You need your three main statements first - income statement, balance sheet, and cash flow. Income shows if you're making money, balance sheet is what you own vs owe, cash flow tracks actual money moving around. Then calculate key ratios like gross margins and debt stuff. Industry matters here - tech companies care about different metrics than restaurants, obviously. Budget vs actual performance is huge too. Oh and don't forget upcoming big expenses or revenue hits. Honestly though? Get those core statements right before you worry about fancy analysis. Everything else builds from there.
Pick your core KPIs and actually stick to them - revenue growth, profit margins, cash flow, ROI. Don't get sucked into vanity metrics that look cool but mean nothing. Track monthly or quarterly with simple dashboards that show you vs last year and industry averages. Honestly, most teams I know are buried under useless spreadsheets. Automate the data pull from your accounting software if you can. Make visual reports so trends jump out immediately. Oh, and set up alerts when numbers hit your danger zones - you'll thank me later when you catch problems early.
Dude, cash flow is literally what keeps your business alive. You could be making money on paper but still go broke if the timing's off - like when customers pay you net-30 but your suppliers want cash upfront. It's wild how many profitable companies fail just because of this. Picture your personal bank account: doesn't matter if you're expecting a big check next month when your mortgage is due tomorrow. I'd check it weekly instead of monthly - gives you way more time to fix things before you're scrambling. Trust me, cash flow problems sneak up fast.
Think of your financial overview as the trailer for your business movie - it's gotta hook investors fast. Show them revenue growth, profit margins, and how much it costs to get new customers. Investors look at dozens of these things daily, so boring = death. I'd put your biggest wins right at the top of a one-page summary. Focus on steady income streams and projections that don't sound totally insane. Keep the numbers simple to follow. Skip the pie-in-the-sky stuff - they want proof you can actually make money consistently, not just wild promises about changing the world.
Honestly, start with the basics - current revenue, what you're projecting, and how fast you're burning cash. Your runway matters a ton. Cash flow statement is non-negotiable since they want to see money actually moving. For SaaS stuff, gross margins are huge. Customer acquisition cost too. If you've got recurring revenue, definitely throw in LTV and your MRR/ARR numbers. I always think it's weird when founders overcomplicate this part though. Just focus on whatever metrics actually make sense for where you're at. Don't dump every possible number on them - they'll tune out.
Dude, economic trends are basically the weather for your money decisions. Inflation goes up? Your costs are gonna follow. Interest rates drop? Maybe it's time to expand. I swear, one GDP report can mess up your entire budget if you're not paying attention. Track maybe 3-4 indicators that actually matter for your business - don't go crazy with data overload. Check them every quarter and build a few different scenarios into your forecasts. That way when things shift (and they always do), you're not scrambling to figure out what it means for your bottom line.
Honestly, the biggest mistake is being way too vague with your numbers - like, actual specifics matter here. Don't forget cash flow projections either, that's huge. I see people make these crazy optimistic assumptions all the time, basically acting like nothing will ever go wrong (spoiler: it will). Seasonal stuff trips people up too, plus random one-time expenses you didn't think about. Oh, and don't throw in every possible financial metric just because you can. Stick to what actually helps you make decisions. Start with your main revenue streams, big expenses, and cash position. You can get into the weeds later if you need to.
Dude, trust me on this - visual templates are a game changer. Nobody wants to stare at endless spreadsheet rows, they'll just tune out. Charts and graphs make your key metrics actually pop, and honestly? A clean dashboard will crush a massive report every single time. Plus you'll look way more professional when everything matches quarter to quarter. People can spot trends faster that way. Oh, and start small - pick your most crucial numbers first, then build simple visuals around those. Don't overcomplicate it right off the bat.
Excel or Google Sheets are your best bet for most financial overviews - everyone already knows how to use them and they're super flexible. QuickBooks works well if you're pulling straight from accounting data. Power BI or Tableau are decent for fancy charts when you're presenting to higher-ups, but honestly? I've watched people blow money on complicated software when a clean spreadsheet would've done the trick. Keep your formulas organized so updates don't turn into a nightmare. Start with whatever you've got access to first. Only upgrade if you actually hit walls, not just because shiny new tools look appealing.
Honestly, the main thing is nonprofits care about mission impact, not just making money. So when you're putting together financials, donors want to see how much actually goes to programs vs admin costs - that ratio matters way more than you'd think. Revenue is trickier too since you're dealing with grants and donations that can be super unpredictable, unlike regular sales. Plus you've got restricted vs unrestricted funds, which is kind of a pain but you need to show it clearly. For-profits are straightforward - just focus on growth and ROI.
Definitely call out seasonality right up front in your overview - it'll save you so much headache later. Which quarters are your strong ones vs weak ones? Like retail always kills it in Q4 with holidays, construction dies in winter, that kind of thing. Compare year-over-year instead of quarter-to-quarter or you'll get totally misleading trends. I've seen too many people act shocked when their numbers dip predictably. Also worth mentioning any weird seasonal stuff that year - maybe weather was brutal or holidays fell weird. Honestly, stakeholders appreciate the context more than you'd think.
Watch out for cash flow problems first - that's what kills most companies even when they look profitable on paper. Rising debt-to-equity ratios are another big warning sign. If customers aren't paying (accounts receivable keeps growing) or inventory is piling up, that's trouble. Profit margins shrinking over time? Not good. Oh, and if the CFO suddenly "pursues other opportunities" or financial reports start coming out late, run. I'd honestly check these numbers every quarter so you can catch problems early instead of being blindsided.
Honestly, comparative analysis is what makes financial data actually useful. You can't just look at numbers in isolation - like saying you ran a 7-minute mile without knowing if that's good for your age, right? Prior periods, industry benchmarks, budget vs actual... that's where the real insights live. Trends become obvious, problems jump out at you. I'd probably start with just 2-3 comparisons that your stakeholders care about most. Otherwise you'll drown in data and miss what actually matters.
So budgets are basically your financial roadmap - they give you something to compare your actual numbers against. Like when you see those variance reports showing budgeted vs actual revenue and expenses? That's where the real story is. Without a budget, you're just staring at random numbers with zero context. It's like trying to navigate without knowing where you wanted to go in the first place. The trick is keeping your budgets realistic and actually updating them regularly. Otherwise you'll be comparing reality to some fantasy numbers from six months ago, which honestly isn't helpful for anyone.
Honestly, you really need to know where your money's going if you want to make decent decisions. A financial overview shows you what's actually profitable vs what's just bleeding cash. Trends become obvious. You'll see if you're hitting targets or way off track - and trust me, most people are way more off than they think. Monthly overviews are clutch for figuring out where to invest next and what to cut. Think of it like a health check for your business. Without it, you're basically flying blind when you sit down for quarterly planning. Start simple, but definitely start.
-
Content of slide is easy to understand and edit.
-
Designs have enough space to add content.